By Antitrust Standards, When Is a Firm Really Failing?
By Lisl J. Dunlop, Partner, Antitrust and Competition | Shoshana S. Speiser, Associate, Litigation
The “failing firm” defense as a justification for permitting a merger that may otherwise lessen competition gets considerable play in healthcare transactions. Perilous hospital economics—often brought on by low Medicare and Medicaid reimbursement rates and high uncompensated care costs—are frequently a significant factor in the economic drivers for merging or entering into a partnership with a neighboring hospital. Very few merging firms, however, have been successful in invoking the defense before the federal antitrust agencies. Two recent cases—one in healthcare and the other in the waste disposal industry—provide insights into using the failing firm defense in practice.
Antitrust Agency Standards
The theory behind the failing firm defense is a lesser of two evils. Its premise is that a merger should be permitted because the resulting threat to competition is outweighed by the adverse impacts if the target firm goes out of business and the assets exit the market. According to agency guidance, for the defense to be recognized, the evidence must convincingly establish that the firm:
- Would not be able to meet its financial obligations in the near future;
- Would not be able to successfully reorganize in bankruptcy; and
- Made good-faith efforts to elicit alternative offers that would keep the assets in the market and pose less danger to competition than the proposed transaction.
Defense Fails If There Is a Failure to Elicit Alternative Offers
In June 2017, a Delaware federal judge agreed with the Department of Justice’s (DOJ’s) Antitrust Division that a merger of two waste disposal companies, Energy Solutions Inc. and Waste Control Specialists LLC (WCS), was likely to result in a monopoly, and that the parties could not rely on a failing firm defense.1
After finding that the merger was likely to result in anticompetitive effects in the market for disposal of low-level radioactive waste, the court turned to the failing firm defense. While there was evidence both to support and to counter whether, in fact, WCS was in imminent financial failure, the court found that it did not need to decide that issue because the merging parties had failed to demonstrate that Energy Solutions was the only possible purchaser. WCS argued that it had a “for sale” sign so any interested parties would have appeared, but the court found that the merger agreement’s “no-talk” provision without a fiduciary out amounted to a willful blindness to alternative buyers. According to the court, those provisions prevented WCS from responding to other offers or sharing information that would permit an interested party to formulate a credible bid.
The court also provided some insight into its views on WCS’s financial position and which arguments it considered. The court noted that WCS never made an operating profit and consistently missed projections because it operates with high fixed costs, and decreased disposal volume over the last decade prevented WCS from covering those fixed costs. The court rejected, however, the argument that WCS would be closed if the merger did not go through, because no steps were taken toward closing the facility.
In particular, the court noted that WCS had made several contradictory representations to regulators, investors and the court. WCS: 1) only opened in 2012 and recently executed several long-term disposal contracts; 2) never defaulted on any debt, was current on its various payments, and was meeting payroll and paying bonuses; and 3) invested in future growth opportunities, particularly in the decommissioning market which is expected to grow substantially over the next 20 years. Additionally, as recently as April 2016, WCS represented to regulators that its financial qualifications were adequate to carry out its activities and that auditors believed WCS would still be in business in a year.
Failing Firm Defense Succeeds in Saving Physician Practice Deal
In January 2017, the Federal Trade Commission (FTC) accepted a settlement in the merger of two multispecialty physician practice groups—CentraCare Health and St. Cloud Medical Group (SCMG) in Minnesota.2 The FTC accepted the settlement partially because the merger, coupled with financial payment incentives for departing physicians, was the best opportunity to keep SCMG physicians in the market, as well as ensure ongoing access to care and minimal disruption for patients in the region. The FTC specifically highlighted that: 1) SCMG had no access to credit; 2) physicians had already left SCMG and would continue to do so, absent the merger; and 3) the parties demonstrated that there were no alternative purchasers interested in acquiring the entire SCMG group.
Key Takeaways
The most important lesson from these two recent attempts by parties claiming the failing firm defense is that failure to demonstrate that the buyer is the only or least anticompetitive option will likely be fatal to the defense, even if the entity is in imminent danger of failing. In particular, a failing firm seeking a buyer should try to avoid “no-talk” or “no-shop” provisions without a fiduciary out in letters of intent or merger agreements, because such provisions will likely be construed as hurdles to identifying reasonable alternative buyers.
Second, financial failure must be probable, and evidence of failure must be concrete, not speculative. A likely future rebound from a financially unstable position may defeat the defense. As the Supreme Court has described it, the firm’s resources must be “so depleted and the prospect of rehabilitation so remote that it faced the grave probability of business failure.”3
Third, consistency is crucial. Statements made by firms to regulators, investors or any other party will be key evidence. When a firm boasts about its financial stability in one context, it cannot turn around to an antitrust agency or court and credibly argue that it is failing.
Fourth, access (or lack thereof) to credit from other sources is critical to the determination of whether the firm is financially stable. In the physician practice group merger, the FTC found that the financially failing party had no access to credit, whereas in the waste disposal deal the DOJ argued that WCS had access to an $85 million revolving credit facility with its parent and that it was not borrowing the maximum amount available.
Finally, evidence that the firm has begun to take steps to exit the market will support a failing firm defense. While the FTC found that physicians were already leaving SCMG’s practice and would continue to do so, the DOJ highlighted that WCS had not yet taken even preliminary steps toward preparing to exit the market and, in fact, had made representations to the contrary.
1United States v. Energy Solutions, Inc., Civ. No. 16-1056-SLR (D. Del. July 13, 2017).
2In the matter of CentraCare Health System, Docket No. C-4594 (Jan. 9, 2017).
3United States v. Greater Buffalo Press, Inc., 402 U.S. 549, 555 (1971).
back to top
Building Effective Post-Acute Care Networks
By Stephanie Anthony, Director, Manatt Health | Carol Raphael, Senior Advisor, Manatt Health | Alex Morin, Manager, Manatt Health
Editor’s Note: An increasing number of hospitals and health systems are seeking to integrate with post-acute care (PAC) by creating networks of preferred providers that collaborate to optimize patient care across settings. A Premier survey of 82 hospitals and health systems found that 95% indicate that developing PAC networks to support population health is a major focus over the next three years.
Manatt Health recently presented a new webinar, summarized below, revealing the drivers behind the rise of PAC networks…the complexities of forming them…and the keys to ensuring success. To view the full webinar free, on demand, click here. To download a free PDF of the webinar presentation, click here.
_____________________________________________
Post-Acute Care: Trends Motivating Transformation
Six key trends are driving transformation in post-acute care:
- The growing recognition that PAC services are a core element of the healthcare continuum
- The significant increases in Medicare PAC spending and service utilization
- The considerable variations in Medicare PAC spending, quality and patient placement
- The large number of payment models being tested, notably in mandatory and voluntary Medicare demonstrations focused on reducing the total cost of care and incentivizing providers to work together to manage patients
- The increasing attention that federal policy imperatives are giving to PAC in efforts to improve healthcare costs and quality
- The major transformation within the PAC sector due to external forces that are disrupting the industry
Why Are PAC Utilization and Spending on the Rise?
The growing elderly population is a key driver of the increasing PAC utilization in the United States. By 2050, one in five Americans will be 65 or older—and that population will double by 2060. The Medicare population that requires PAC after a hospital stay also is on the rise, increasing from 37.5% in 2008 to 42% in 2015.
The increasing prevalence of chronic conditions—particularly in the 65 and older population—is also driving the growth in PAC utilization. Almost 88% of the 65-74 year old population have one or more chronic conditions. In fact, a quarter of Medicare beneficiaries have five or more chronic conditions, such as hypertension, diabetes, cancer, heart disease and/or arthritis. It is hard to conceive of providing care only within inpatient settings for so many grappling with long-term chronic conditions.
These factors are combining to drive increased demand for PAC, which is projected to continue growing over the next decade. Between 2012 and 2021, service demand is expected to shift away from hospitals and toward outpatient and PAC settings. The most significant growth will be in home care, with demand expected to increase by 35%.
As PAC utilization has risen, Medicare spending on PAC services has experienced exponential increases. Medicare now spends nearly $60 billion per year, or 12% of its total expenditures, on PAC services. In fact, Medicare drives the economics of PAC providers, covering nearly three-quarters of discharges to PAC. Across all healthcare providers, Medicare accounts for about 39% of their income streams. That number soars to 73% for PAC providers.
Variations in PAC account for 73% of the variation in total Medicare spending. For example, top-performing skilled nursing facilities have an average length of stay of 24 days, while low performers have an average stay of 34 days—a $4,000 per admission difference.
There are also wide variations in placement decisions and quality measures. There is no unified approach to placement decisions, and similar patients can be placed in different settings with different care plans. Quality measures are also inconsistent, with quality assessed differently across different sites of care.
PAC Is an Integral Part of Payment and Delivery System Reform
The new demonstrations designed to reduce the cost of care while improving outcomes have begun to reveal how important PAC is in the healthcare system. Consider readmission reductions. Readmission during a PAC episode more than doubles the Medicare payment and results in readmission penalties for acute care providers. If we look at bundled payments, it’s clear that an episode-based payment model requires a seamless transition to a PAC setting. Even accountable care organizations have begun to think differently about PAC, with some providing incentives for providers to manage the total cost of care.
The Centers for Medicare & Medicaid Services (CMS) is testing several voluntary and mandatory Medicare bundled payment models that link acute and PAC providers and rationalize utilization of PAC services. With a new administration in place, all demonstrations are under review, but the momentum toward value-based reimbursement models remains strong.
Care Coordination: A Key Strategy for PAC Providers
Providers increasingly are adopting best practices in care coordination that optimize transitions from the hospital to the PAC setting. Providers are realizing that they need to have specific goals to demonstrate what they are able to accomplish through care management and drive continuous process improvements. They also need to target their care management resources more effectively, ensure care managers are well trained and fully embedded within care teams, use evidence-based care management interventions, and share accountability across providers.
Policymaker Concerns Led to the Bipartisan IMPACT Act
Four areas have become key concerns for federal policymakers in the PAC arena:
- Reimbursement. Policymakers are concerned about providers attempting to maximize reimbursement and, in some cases, engaging in fraudulent activity.
- Tightening of regulations. Dramatic growth in the Medicare PAC program has led to tighter coverage and payment rules, provider moratoriums (such as the moratorium on new entrants to long-term acute care hospitals through the end of 2017), and increased quality reporting.
- Misplaced incentives. The provision of excess services, a reluctance to take the most medically complex patients and decisions that are not clinically optimal all can result from misplaced incentives.
- Overpayments. The PAC sector has historically high margins leading to efforts aimed at reducing reimbursement growth rates and shrinking margins.
This set of shared concerns led to bipartisan support of the IMPACT Act. Passed in September 2014, the Act seeks to reduce overall PAC spending and tie payments to patient characteristics and outcomes-based performance measurement. It calls for a unified, site-neutral payment system; a uniform assessment tool; consistent public quality reporting; and incentives to serve higher-need populations.
In an April 2017 update, MedPAC unanimously approved a recommendation to move ahead with implementing the new unified payment system beginning in 2021, with a three-year transition. The five-year goal is to lower spending between $5 billion and $10 billion.
Key PAC Developments
Given the challenging economics and the need to scale in the marketplace, a key development in the PAC market has been increasing consolidation. Other major developments include:
- Building partnerships and collaborations with integrated delivery systems
- Offering care management to smooth transitions
- Customizing clinical protocols and being more nimble
- Assessing risk arrangements and ensuring accountability for costs
- Recognizing the diversity of populations and the need for targeted interventions
- Facilitating information exchange
- Measuring, reporting, and continually improving quality and satisfaction levels
- Offering services across a continuum and addressing the social determinants of health
- Applying technology, such as telemarketing and wearables
- Heightening private equity interest
Breaking Down the Silos Between Acute Care and PAC
There is increasing focus on bridging the gap between acute care and PAC delivery, as well as developing more integrated provider relationships. In particular, demographic, disease state and clinical acuity changes, as well as the shift in payers’ goals and financial incentives, are pushing providers to break down the silos in care delivery and view care more holistically and from the patient’s perspective. For health systems and PAC providers, that means developing more aligned upstream and downstream relationships that focus on improving processes during transitions of care and better managing the entire episode of care.
Hospitals can no longer just think about what happens inside their own walls, particularly because readmissions hit their bottom lines, either through financial penalties or performance-based incentives. PAC providers also need to change their approach to think more strategically about enhancing their relationships with their referral sources.
Health System Objectives for PACs
Hospitals are typically the drivers of tighter relationships between acute care and PAC providers. Their key goals include reducing the average length of stay, improving patients’ clinical outcomes and functional status, enhancing the management of financially high-risk patients, creating market differentiation, improving the patient experience, and managing the continuum of care through a population health approach.
Hospitals and health systems considering enhancing their PAC relationships first must decide whether they will build a PAC network in-house or buy outside PAC services. Both approaches are time- and resource-intensive and come with financial and legal risks. Therefore, most hospitals choose to integrate with PAC providers through partnerships that align across institutional and community care settings.
The formation of preferred PAC networks is still in its early stages, although there have been some leader health systems that have made significant progress in integrating with their PAC partners. In addition, payers have begun to put incentives in place for delivering high-quality, low-cost, coordinated care that minimizes readmissions, reduces average length of stay and increases hospital throughput. These incentives have been instrumental in driving hospitals’ growing focus on integrating PAC services into their clinical delivery models.
What Is a PAC Preferred Provider Network?
A PAC preferred provider network is a partnership between hospitals or health systems and PAC providers focused on optimizing the patient experience for the treatment of conditions that extend across acute and PAC sites of care. Elements include a shared commitment to provide quality care and optimize the patient experience across settings, as well as shared policies and procedures regarding acute and PAC care, including transitions between them.
PAC preferred provider networks offer significant advantages to hospitals and PAC providers. Hospitals benefit from immediate and consistent access to PAC services, increased throughput, enhanced efficiency, seamless care coordination, reduced readmissions and unnecessary emergency room visits, and improved patient loyalty. PAC providers benefit from more consistent and predictable referral volumes, better access to clinical support, competitive differentiation, enhanced preparation for the acute/PAC bundled reimbursement models, and brand opportunities that come from network participation.
Most importantly, PAC provider networks offer mutual benefits to acute and PAC providers. Joint benefits include sharing patient data, jointly developing quality initiatives, sharing protocols and clinical pathways to maximize treatment effectiveness, ensuring consistent patient transfer processes, managing patients collaboratively, marketing care services based on quality outcomes, and preparing for population health and value-based payment initiatives.
Developing a PAC Preferred Provider Network
Let’s look at a high-level process for setting up PAC preferred provider networks. We will view the process through the lens of a health system, but neither the process nor the networks are one directional. In fact, PAC Preferred Provider Networks are only successful to the extent that the participants are fully collaborative. There are three sequential steps that are fundamental to establishing effective PAC Preferred Provider Networks:
Step 1: Baseline Assessment of the PAC Population. This step includes documenting organizational objectives for working with PAC providers to manage populations, understanding the discharge process and transition to PAC providers from a frontline perspective, and developing a fact-based assessment of the Medicare PAC populations and the demand for PAC services. At this stage, it’s critical to identify where patients go for PAC today and to map the competitive landscape.
Step 2: Preferred Provider Network Architecture and Partners. During this phase, it’s essential to understand the performance and capabilities of local PAC providers and their potential for inclusion in the network; identify the objectives and requirements for network participation; and define the terms of participation, including policies related to discharge planning, patient choice, information sharing, care coordination and clinical support. It’s important at this stage to consider how best to build on organizational strengths and mitigate strategic weaknesses. This phase also is the time to identify potential partners and their requirements.
In evaluating possible partners, consider quantitative elements, such as scope and volume (i.e., number of beds, patient acuity, geographic position and average length of stay); quality and safety measures, including Medicare-reported quality ratings; patient experience and reputation (i.e., financial performance, patient experience surveys and payers accepted); and miscellaneous factors, such as data-sharing capabilities, languages spoken and willingness to integrate electronic medical records. In addition, don’t overlook important qualitative elements such as vision, culture and approaches to care.
Step 3: Ongoing Process Improvement. During step 3, jointly develop a quality scorecard with shared metrics and benchmarks over time, adopt a culture of continuous process improvement, and revisit and update policies and procedures at least once a year. At this phase, determine how to keep all partners accountable for quality and performance and ensure ongoing collaboration and adoption of best practices.
Conclusion: Lessons Learned
Important lessons can be learned from those who have effectively established PAC Preferred Provider Networks across the country. The keys to success include understanding that:
- A collaborative development process between acute and PAC partners is critical.
- A one-size-fits-all approach may not work. Tailored approaches and agreements between a hospital and an individual PAC provider may be needed.
- Investing the time to appreciate individual goals and document shared objectives and requirements for network participation up front streamlines network formation.
- Frontline staff (such as physicians, nurses and social workers) are the lynchpins of successful relationships between acute and PAC providers—and should be active participants in forming preferred provider networks.
- It is critical to continually monitor, evaluate and adjust strategies around improving care quality and patient communications.
back to top
Digitizing Patient Journeys: A Key Element of High-Value Care
By Jared Augenstein, Senior Manager, Manatt Health | Mary Ermitanio, Manager, Manatt Digital | Alice (Ali) Loveys, MD, FAAP, FHIMSS, ABP-CI, Senior Advisor, Manatt Health | Ruth Kidane, Analyst, Manatt Health
Last month, Manatt Health’s first article in our new digital health series discussed the need for organizations to have a digital health strategy aligned with their organizational visions. Robust digital health governance helps organizations prioritize new tools to purchase, develop and/or implement. In particular, technology continues to expand its reach and its potential to have a positive impact on unique patient journeys. The emergence of robust, validated digital health tools can increase patient engagement in care, improving outcomes, reducing costs and allowing health systems to succeed under a range of payment models.
Customer Service Elements Applied to the Healthcare Market
Let’s start our discussion about digitizing the patient journey with a few assumptions about the healthcare market:
- Digital health tools are increasingly used in clinical practice and will continue to become more helpful and sophisticated.
- Payment models are shifting from fee-for-service to value-based payments, and health systems will require new tools to maintain profitability under value-based models.
- Health systems will continue to focus on improving patient engagement and satisfaction results on the Hospital Consumer Assessment of Healthcare Providers and Systems (HCAHPS), a patient satisfaction survey required by the Centers for Medicare & Medicaid Services (CMS) and the Net Promoter Score® (NPS), a customer experience metric that predicts business growth.
Patients are ultimately consumers of services. In hospitality, retail and other industries, there are key elements of excellent customer service that can also be applied to healthcare—and that patients and families are coming to expect.
- Mobile-First Experience. Online platforms such as OpenTable, Airbnb and Uber have long enabled consumers to find and book restaurant, home or taxi reservations in seconds from a mobile device. Finding the right doctor is not as simple, yet consumers long for the ability to access information, products and services when they want them and where they want them. Companies like Zocdoc provide health systems with the platform they need to make this a reality.
- Targeted and Personalized Outreach. Much of Netflix’s success can be attributed to its sophisticated recommendations engine which provides personalized content suggestions based on user behavior. Health systems will need to deliver more personal, timely and relevant messages to patients and families using troves of existing patient data to meaningfully enhance patient engagement and self-management in care. For example, Providence Health & Services developed Circle, a mobile app for expectant and new mothers that provides personalized educational tools, step-by-step checklists, health trackers and references to local resources.
- Sustained, Meaningful Engagement. Nearly every major sector outside of healthcare uses multichannel distribution and engagement strategies for consumer engagement, entertainment and education. Health systems must do the same, leveraging the power of online distribution to engage patients with the health system brand by providing useful and relevant content. They must offer tools that present opportunities for interacting with health systems outside of brick-and-mortar facilities. For instance, leading health systems have begun to deploy multichannel virtual care platforms that allow patients to access clinical advice via text, secure message, phone and video.
The Benefits of Highly Engaged Patients
Only by fully understanding patient journeys can health systems provide digital tools that patients actually want to use and that truly improve clinical care. Health systems should start by assessing the current patient journey and identifying all patient touch points—both physical and digital. For each touch point, health systems must understand a patient’s preferences and concerns. This type of assessment can surface opportunities for improving the patient experience. For many of these opportunities, digital technologies can be leveraged to power more effective and engaging consumer experiences.
But why go through all this effort? Highly engaged patients bring numerous benefits to health systems:
- Better Health Outcomes and Lower Costs. By increasing patient engagement and patient-physician communication, digital tools can directly improve health outcomes and lower costs. Patients engaged in online platforms are both more adherent to treatment regimens and less likely to need costly in-person care.
- Increased Patient Loyalty. Health systems can use digital health tools to strengthen patients’ knowledge, skills and confidence in managing their care. Kaiser Permanente found that patients using its digital tools “were more adherent to treatments, more satisfied with their care, and more loyal: they were two to three times more likely to stay with Kaiser Permanente than their non-connected cohorts.”1
- Higher Patient Satisfaction and Reimbursement. HCAHPS measures patient perceptions of care along several dimensions, including communication, care coordination and responsiveness. Digital health tools can improve all of these metrics. For example, Sentara Health, a multi-hospital system based in Virginia, realized an improvement in its HCAHPS scores after implementing a digital rounding tool from CipherHealth.2
Health systems will need to be deliberate and thorough as they incorporate digital health tools into their patient engagement, clinical operations and process improvement efforts. As a first step, they need to prioritize which patient journeys are ripe for “digitization.” At-risk health systems may benefit most from focusing on chronic care management journeys for high-need, high-cost patients. Health systems that still operate in a fee-for-service world may focus on improving journeys that generate new customers.
Once there is agreement on which health journeys to prioritize, health systems must determine the appropriate technology, clinical and operational resources required to effectively redesign that care journey in a way that is not disruptive to clinicians and other frontline staff. Systems should look first to technology companies that offer a proven product before developing tools in-house.
Finally, health systems must continually test and improve digital health tools in practice. Consumer engagement with digital tools is new to healthcare and will require focused testing and rapid-cycle improvement to reach meaningful adoption levels and have a measurable downstream impact on both the patient experience and clinical outcomes.
1http://www.mobihealthnews.com/38904/kaiser-members-who-use-app-are-more-adherent-satisfied-and-loyal/
2http://www.beckershospitalreview.com/healthcare-information-technology/improving-patient-outcomes-by-staff-satisfaction-through-digital-rounding.html
back to top
Attorneys General Discuss Strategies to Reduce Opioid Abuse
By Richard P. Lawson, Partner, Consumer Protection
This past June, a multistate bipartisan investigation of any drug manufacturers engaged in unlawful practices in the sale and marketing of opioids was announced. The attorneys general from both reliably red states, such as Texas, and true-blue states, such as Illinois, shared the news that they and others will use their full investigatory powers to examine companies making and selling opioid products. This united front around the opioid crisis was on display at the annual meeting of the Conference of Western Attorneys General on July 31 in San Francisco.
The partisanship that dominates the national political scene took a brief respite during the conference as attorneys general and their representatives from both sides of the aisle joined together to discuss their efforts to combat opioid abuse. The attorneys general from Oklahoma, Florida, North Carolina, Wisconsin and North Dakota, and a senior staff member from the California attorney general’s office addressed the gathering to discuss strategies for reducing opioid abuse. Common to all presentations were concerns over the rapid growth of the opioid problem, the overprescribing of opioids, and the use of prescription opioids as a gateway to heroin and other drugs.
Detailing the Severity of the Opioid Problem
Setting the tone of the conversation were some sobering statistics from Attorney General Josh Stein of North Carolina, who reported that every day, four North Carolinians die from a medication or drug overdose. Attorney General Brad Schimel of Wisconsin reinforced the severity of the problem, sharing the experiences in his state which reflect the rapid growth of the opioid crisis, a theme echoed by all the attorneys general speaking at the conference. Schimel tracked the rising number of heroin prosecutions across Wisconsin, which soared from 273 that went to trial in 28 counties during 2008 to 1,168 that went to trial across 60 counties during 2016. In just eight years, the number of heroin prosecutions in Wisconsin had more than quadrupled.
Underscoring the severity of the problem, Schimel also explained that four out of five heroin users began by abusing prescription drugs. Further, he noted that opioid users also turn to meth and fentanyl.
To illustrate the size and scope of the crisis in Wisconsin, Schimel shared that since 2015, drug take-back programs in his state had brought in 275,000 pounds (equivalent to 15 semi-tractor trailer loads) of overprescribed medications. To complicate the issue further, 70% of users were able to get access to opioids through family and friends rather than needing to secure their own prescriptions.
Fighting Back Against the Opioid Crisis
To combat the opioid crisis, 49 states have created prescription drug monitoring programs (PDMP). Attorney General Pam Bondi of Florida recounted her efforts to get a PDMP established by the Florida legislature—and the dramatic decline in the volume of opioid prescriptions in Florida after the PDMP was enacted. To add power to the fight against opioid abuse, Attorney General Stein detailed his efforts to champion a synthetic opioid control act in North Carolina as a way to get ahead of those who manufacture fentanyl analogues that mimic the effect of opioids while avoiding classification as illegal or controlled substances.
The discussion during the conference gives clear proof that addressing the opioid issue is a high priority for attorneys general. There are usually three key arrows in any attorney general’s quiver: education, legislation and enforcement. Attorneys general have been vocal in their states and at events, such as the conference, to help educate their constituencies and express their concerns.
Attorneys General Bondi and Stein have demonstrated the role that attorneys general across the nation can play in combating opioid abuse, serving as the chief lobbyists for consumer-related issues within their respective legislatures. In terms of enforcement, the emphasis attorneys general from across the country are placing on the opioid issue is indicative of their grave concerns that are fueling the bipartisan investigation.
back to top
New Manatt Webinar: “Fraud and Abuse 2017”
Join Us September 11 from 1:00–2:30 p.m. ET and Learn How to Avoid FCA Actions in the Face of Tightened Enforcement.
New Speaker Added: Rick Hartunian, Former U.S. Attorney for the Northern District of New York
In fiscal year 2016, the Department of Justice (DOJ) recovered $2.5 billion from healthcare fraud cases, marking the seventh consecutive year that healthcare civil fraud recoveries exceeded $2 billion. Between January 2009 and the end of FY 2016, the DOJ recovered $19.3 billion in healthcare fraud claims—and these figures represent just federal dollars. In many cases, the DOJ was instrumental in recovering additional millions of dollars for state Medicaid programs. And states continue to bring their own healthcare fraud cases.
In a new webinar for Bloomberg BNA, Manatt examines the growing use of the False Claims Act (FCA) as an enforcement tool and other enforcement trends—including increasingly aggressive techniques, from predictive modeling to wiretaps—making the healthcare landscape more perilous than ever before in history. (Special Note: New Manatt partner Rick Hartunian—former U.S. Attorney for the Northern District of New York—has now joined our webinar faculty. Rick’s presentation will focus on the DOJ’s healthcare enforcement priorities and other key enforcement developments.) Click here to register for the webinar free—and earn CLE.
Key topics include:
- The types of FCA violations being investigated for each healthcare segment
- Current trends in recoveries—and what’s next
- The implications of the Escobar decision on implied false certification, materiality and FCA cases moving forward
- Other major FCA cases that are remapping the fraud and abuse landscape—and the decisions to watch for in the year ahead
- Innovative enforcement techniques that are changing the game
- The impact of recent DOJ cases on decisions relating to Medicare Advantage
- The enhanced provisions that are increasingly common in Corporate Integrity Agreements (CIAs)
- Strategies for protecting your organization, including how to build effective compliance programs and what to do if faced with a government investigation
Even if you can’t make the original airing on September 11 from 1:00–2:30 p.m. ET, click here to register free now, and you will receive a link to view the program on demand.
Presenters:
Jacqueline C. Wolff, Partner, Co-chair, Corporate Investigations and White Collar Defense, and Co-chair, False Claims Act Practice
Richard S. Hartunian, Partner, Corporate Investigations and White Collar Defense
Randi Seigel, Counsel, Manatt Health
back to top
Using Statistical Sampling in False Claims Act Cases
By John M. LeBlanc, Partner, Healthcare Litigation | Andrew H. Struve, Partner, Healthcare Litigation | Sarah E. Gettings, Associate, Litigation
The False Claims Act (FCA) is silent about whether statistical sampling may be used to prove a violation of the Act and, since the case law is varied, there are no clear rules about when or how statistical sampling evidence may be introduced. Two cases—the Fourth Circuit’s recent decision in Agape and the Supreme Court’s decision last year in Tyson, a wage and hour class action—show that litigants will probably never obtain a bright-line rule on the use of sampling evidence to prove liability. Instead, decisions will turn on the specific facts of each case and the validity of the sampling methodology.
In the context of the FCA, courts are generally willing to permit the use of statistical sampling to prove damages where liability is not contested or has already been established.1 This is consistent with decisions in other complex cases, where expert sampling evidence has enjoyed widespread acceptance in state and federal courts as the basis to prove damages.2 However, courts are split about the use of sampling to prove liability under the FCA. In some cases, courts have rejected the use of sample extrapolation to prove a violation, finding that the falsity element under the FCA cannot be proven through expert medical necessity reviews that involve subjective clinical judgment.3 In other cases, courts have allowed the use of sampling to establish liability, holding that any challenge to the sample could be effectively addressed through cross-examination of the government’s expert and presentation of a competing expert and evidence.4
In prior cases, defendants argued in favor of a per se prohibition on the use of sampling to prove liability, claiming it constituted a violation of due process as a matter of law. But, as Agape and Tyson show, defendants must now instead focus on the specific facts of their cases, as there is no clear prohibition against the use of sampling evidence.
Tyson Foods, Inc. v. Bouaphakeo
Indeed, it was the Supreme Court, outside of the FCA, that last year refused to create a blanket prohibition on the use of sampling evidence to prove liability in the class action context.5 In Tyson Foods, Inc. v. Bouaphakeo, employees at a meat processing plant filed a putative class action against Tyson under the Fair Labor Standards Act, alleging the company failed to pay them overtime for time spent “donning and doffing” their protective gear. The company did not maintain any records of how long each employee spent performing this task each day.
To prove liability, the plaintiffs retained an expert to estimate the average time employees in different departments spent on the task and another expert compared those averages to each employee’s recorded hours to identify alleged violations of the FCA. The key dispute in the case was whether differences in the time employees spent “donning and doffing” gear made the plaintiffs’ expert evidence too speculative to prove classwide liability.
The Supreme Court found that the employees were sufficiently similarly situated, and it refused to create a “categorical exclusion” or ban on statistical sampling to establish liability, explaining the use of sampling evidence would hinge, like other evidence, on its reliability. As the Court explained, the “fairness and utility of statistical methods in contexts other than those presented here will depend on facts and circumstances particular to those cases.”
United States ex rel. Michaels v. Agape Senior Community, Inc.
Earlier this year, in United States ex rel. Michaels v. Agape Senior Community, Inc., the Fourth Circuit addressed a similar question in the FCA context.6 (In this case, the relators alleged that the defendant caused the submission of false claims for hospice reimbursement. The Medicare regulations governing the hospice benefit require physicians to certify that the patient seeking the benefit has a terminal illness with a prognosis of surviving six months or less. At the district court, the relators had tried to use statistical sampling to establish liability.)
The FCA defense bar highly anticipated the decision, hoping it would provide a bright-line prohibition against the use of sampling to prove liability under the FCA. When presented with the issue, however, the Fourth Circuit too took a fact-specific approach and refused to create a categorical exclusion against its use. The Court dismissed the relator’s appeal on the issue as “improvidently granted,” holding that interlocutory review was not appropriate since the statistical sampling is not a “pure question of law.” In other words, sampling may or may not be appropriate to prove liability; it depends on the specific facts of the case.
Conclusion
How does the Court’s guidance in Tyson help us understand when statistical sampling may be used in FCA cases? In FCA cases, sampling evidence is typically used to challenge the medical necessity of the claims for reimbursement submitted to the government. In Tyson, the Supreme Court emphasized that the expert’s testimony regarding average times “did not deprive [Tyson] of its ability to litigate individual defenses,” and thus did not violate due process, because the company did not maintain any records, so “there were no alternative means for the employees to establish their hours worked.” That reasoning would arguably not apply to many FCA cases in which the provider maintains the medical records that support its claims for reimbursement and where the use of statistical sampling evidence would arguably deprive the defendant of the right to present individual defenses to each claim.
Despite hopes that Tyson would provide a definitive answer, there continues to be no blanket prohibition against the use of statistical sampling to prove liability. Therefore, it is critical to consider the specific facts and circumstances of each individual case to determine the appropriateness of using statistical sampling, including the reliability of the sampling evidence, whether there are any potential violations of due process and whether there are other options for obtaining accurate information.
1E.g., United States v. Rogan, 517 F.3d 449 (7th Cir. 2008), United States v. Fadul, No. DKC 11-0385, 2013 WL 781614 (D. Md. Feb. 28, 2013), United States v. Robinson, No. 13-CV-27-GFVT, 2015 WL 1479396 (E.D. Ky. Mar. 31, 2015).
2Steffey, Duane L. et al., Statistical Assessment of Damages in Breach of Contract Litigation, 46 Jurimetrics J. 129 (2006) (“[T]oday, ‘sampling no longer faces serious doctrinal obstacles.’ Legal endorsements of sampling may be found in such sources as the Federal Rules of Evidence, the Federal Judicial Center’s Reference Manual on Scientific Evidence, and the Manual for Complex Litigation. Sampling and survey evidence now figures prominently in selected areas of litigation—particularly in antitrust, employment discrimination, and toxic torts. It has also been used in auditing the accuracy of accounts and other monetary records.”; Saks, Michael J. et al., Justice Improved: The Unrecognized Benefits of Aggregation and Sampling in Mass Torts, 44 Stan. L. Rev. 815 (1992); 3 Newberg on Class Actions (4th ed.) § 10.3 (aggregate class proof of monetary relief may be based on sampling techniques); Federal Judicial Center’s Reference Manual on Scientific Evidence (3d ed. 2011), p. 376; Manual of Complex Litigation (4th ed. 2004), § 11.493 (outlining criteria for determining the admissibility of sampling including a proper population, a representative sample, accurately reported data and proper statistical analysis of the data); The New Wigmore: Expert Evidence (2d ed. 2017), § 12.6.2 (citing cases relying on statistical sampling).
3United States ex rel. Wall v. Vista Hospice Care, Inc., No. 3:07-cv-00604-M, 2016 WL 3449833 (N.D. Tex. June 20, 2016).
4United States v. Life Care Centers of America, Inc., 114 F. Supp. 3d 549 (E.D. Tenn. 2014); United States v. Robinson, 2015 WL 1479396, at *10 (E.D. Ky. Mar. 31, 2015) (admitting sampling evidence and collecting cases supporting the finding that “statistical sampling methods and extrapolation have been accepted in the Sixth Circuit and in other jurisdictions as reliable and acceptable evidence in determining facts related to [False Claims Act] claims as well as other adjudicative facts”).
5Tyson Foods, Inc. v. Bouaphakeo, 136 S.Ct. 1036 (2016).
6United States ex rel. Michaels v. Agape Senior Community, Inc., 848 F.3d 330 (4th Cir. 2017).
back to top
Dental Services Remain Unaffordable for Many Low-Income Americans
By Kevin Casey McAvey, Senior Manager, Manatt Health
Approximately one-third of Americans remained without dental insurance in 2014 despite coverage gains—particularly for nonelderly adults—from the implementation of the Affordable Care Act (ACA). Dental uninsurance rates were highest for those over the age of 65 (62%), and lowest for those under 18 years old (11%). Approximately 35% of nonelderly adults lacked dental coverage.1
For many, having insurance is a financial necessity for seeking treatment, especially for preventative care and disease maintenance. Left untreated, oral disease can quickly escalate from a local issue to a holistic concern. It can severely undermine personal health and well-being, with increased risks of medical comorbidities (e.g., heart and lung disease, stroke, and diabetes), chronic pain, sleep deprivation and nutritional deficiency. It also can result in appearance issues that can be detrimental to employment prospects and retention.2
Although the ACA Boosted Dental Coverage, Many Still Forgo Care Due to Costs
The ACA bolstered dental coverage, directly and indirectly, through several provisions. Pediatric dental care was added as an Essential Health Benefit (further strengthening already robust Medicaid and CHIP coverage for children), state Medicaid programs were allowed to expand coverage at enhanced federal payment rates for low-income nonelderly adults (up to 138% of the federal poverty level (FPL)), and parental health insurance was required to cover children up to age 26.
Though Medicaid expansion and dependent-coverage provisions targeted medical care, nearly all Medicaid expansion states extended their base populations’ dental benefits to their new expansion populations, and increases in young adult private market medical coverage were closely tied to increases in dental coverage.3 (The robustness of state Medicaid dental benefits, however, continued to vary considerably, with one-quarter of “dental-coverage states” only offering emergency service coverage, continuing to leave many “covered” individuals financially exposed.4)
However, in 2015, more than one in five (21%) low-income Americans still reported forgoing needed dental care due to cost—a rate four times higher than that for high-income earners—though data suggest ACA-related coverage gains may have alleviated financial vulnerability for some (Figure 1).5 Cost as a barrier for the lowest-income earners (making less than the FPL) fell by nearly a third (30%) between 2010 and 2015, and declined 28% for those making between 100% and 200% of the FPL. Rates for all income categories improved from highs experienced during the Great Recession, as economic conditions improved.
Figure 1: Delay or Nonreceipt of Needed Dental Care Due to Cost by Patient Income Level (2000-2015)
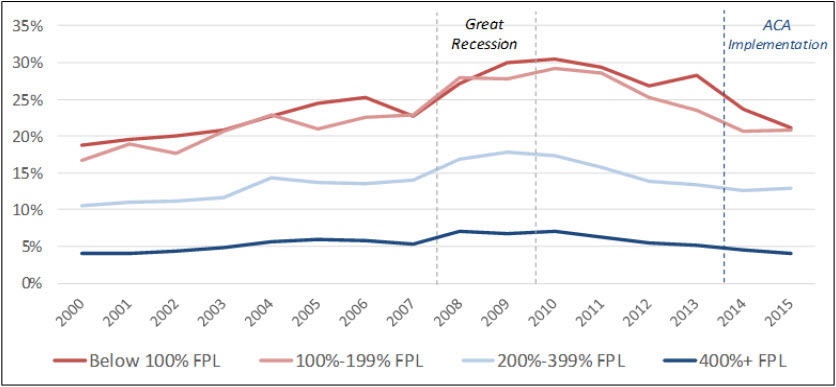
Source: Manatt Health analysis of National Center for Health Statistics, National Health Interview Survey data (2000-2015).
Cost-as-barrier rate declines were also observed across nearly all nonelderly age breakouts, and were particularly evident for those aged 18 to 24, where unmet needs nearly halved to 9.4% (Figure 2).
Figure 2: Delay or Nonreceipt of Needed Dental Care Due to Cost by Patient Age (2010 vs. 2015)
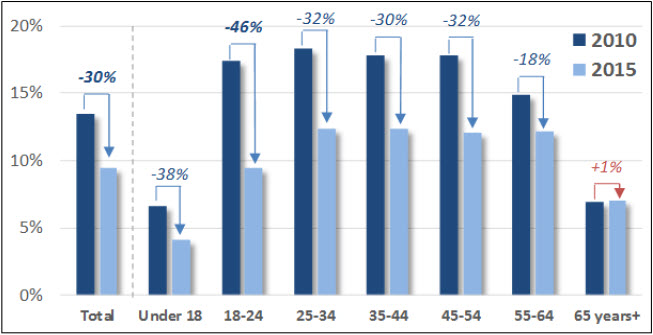
Source: Manatt Health analysis of National Center for Health Statistics, National Health Interview Survey data (2010, 2015).
Dental Visits Increased With Coverage Gains Though Challenges Remain
Dental visits also rose with coverage levels, though gains were more muted, potentially indicating challenges with provider availability.6 According to the 2017 American Dental Association’s “Support of Dentists” survey, slightly more than a third of general dental practices (36%) accepted Medicaid patients in 2015, and Medicaid patients comprised only 9% of the overall dental patient population. A June 2017 study in Health Affairs suggests that while Medicaid expansion may have increased oral health coverage, access, counterintuitively, may have declined as the limited number of Medicaid-accepting dental practitioners faced increased demand.
For more information on how Manatt Health uses data, modeling and analytics to support the development and implementation of data-driven strategies and program actions, please contact Kevin McAvey at KMcAvey@Manatt.com.
1According to an American Dental Association Analysis of Medical Expenditure Panel Survey (MEPS-HC): Nasseh, Kamyer, and Marko Vujicic, “Dental Benefits Coverage Increased for Working-Age Adults in 2014,” American Dental Association Health Policy Institute. October 2016. Available at: http://www.ada.org/~/media/ADA/Science%20and%20Research/HPI/Files/HPIBrief_1016_2.pdf. The ADA found that 5.8% of nonelderly adults had “public” benefits (i.e., Medicaid) without dental benefits in its first year of breaking out public coverage.
2Hinton, Elizabeth and Julia Paradise, “Access to Dental Care in Medicaid: Spotlight on Nonelderly Adults,” Kaiser Family Foundation. March 17, 2016. Available at: http://www.kff.org/report-section/access-to-dental-care-in-medicaid-spotlight-on-nonelderly-adults-issue-brief/.
3Medicaid-dental coverage expansion: “Young Adult Coverage,” HHS.gov. Available at: https://www.hhs.gov/healthcare/about-the-aca/young-adult-coverage/index.html; Dependent-dental coverage expansion: Vujicic, Marko et al. “The Effect of the Affordable Care Act’s Expanded Coverage Policy on Access to Dental Care,” Medical Care. August 2014. Available at: http://journals.lww.com/lww-medicalcare/Abstract/2014/08000/The_Effect_of_the_Affordable_Care_Act_s_Expanded.7.aspx.
4As of February 2016, Medicaid programs in 46 states and DC provided some level of dental benefits for their Medicaid populations. Approximately one-quarter of states (12) that offered benefits only offered emergency service coverage, and only 16 covered “extensive services” such as periodontics, dental work which—though not usually life threatening—can have substantial impacts on patient health and well-being.
5“Health, United States, 2016,” Table 63, “Nonreceipt of needed dental care during the past 12 months due to cost, by selected characteristics: University States, selected years 1997-2015.” Statistic applies for civilian noninstitutionalized individuals with incomes below the Federal Poverty Level or between 100% and 200% of the FPL. Available at: https://www.cdc.gov/nchs/data/hus/hus16.pdf.
6In 2015, 46% of lower-income residents reported having a dental visit, up three percentage points since 2013. Interestingly, though low-income white residents’ visit rates held largely constant, rates for Hispanics and Blacks showed significant increases; low-income Blacks reported the highest levels of dental utilization since the survey began.
back to top