Manatt Spotlights

The Manatt State Cost Containment Update


March Spotlight

In this issue, Manatt provides a refresher on California’s new Office of Health Care Affordability and an update on next steps for its newly elected Affordability Board, and also breaks down Congressman Don Beyer’s National All-Payer Claims Database Act of 2022, which was introduced shortly after Manatt’s December 2022 National All-Payer Claims Database Summit, renewing discussions on the Hill about the value of national health system transparency. 

  • California Gets Rolling: Health Care Affordability Board Appointed and Set to Convene on March 21, 2023: In early March, California’s Office of Health Care Affordability (OHCA) announced its Health Care Affordability Board members and set the date for the Board’s first meeting: Tuesday, March 21, 2023.
  • Manatt All-Payer Claims Database Summit Renews Congressional Interest in a National APCD: On December 7, 2022, with support from the Robert Wood Johnson Foundation (RWJF) and the Peterson Center on Healthcare, Manatt hosted the National All-Payer Claims Database (APCD) Summit, where public and private health care stakeholders offered support for the recommendations in Manatt’s report “Realizing the Promise of All Payer Claims Databases: A Federal and State Action Plan,” including the establishment of a national APCD and enhancing State Health Data Organizations (HDOs) funding. Following the Summit, Congressman Donald Beyer introduced the National All-Payer Claims Database Act of 2022 (H.R. 9644), which codified many of the paper’s recommendations—and renewed discussions on the Hill about the value of national health system transparency.

A PDF of our update is also available here.

California Gets Rolling: Health Care Affordability Board Appointed and Set to Convene on March 21, 2023

The takeaway. In early March, California’s Office of Health Care Affordability (OHCA) announced its Health Care Affordability Board members and set the date for the Board’s first meeting: Tuesday, March 21, 2023. California’s health care public and private industry leaders—many of whom have only become recently aware of OHCA’s cost containment authorities—will be listening closely to understand the vision of the Office’s new Deputy Director, Vishaal Pegany (previously an Assistant Secretary at CalHHS), for the state’s benchmarking program and how the state’s new spending targets will be set to account for the dynamics of the nation’s largest, and potentially most complex, health care market. State leaders will not be the only ones listening. As America grapples with health care costs that continue to rise, comprising greater shares of household salaries and state budgets, state policymakers and regulators are looking to health care cost growth benchmarking programs as potential tools to better understand and address health care cost drivers.

With California’s passage of the Health Care Quality and Affordability Act in 2022, ten states1 have cost growth benchmarking programs in place or in development, covering over 70 million people—or one in five Americans. California’s statewide cost growth benchmarking program aims to measure the market in new ways, as its leaders strive to identify and stem cost drivers, promote consumer affordability, improve health equity, and maintain high-quality care. However, much of the state’s program remains undefined, left to be designed through implementation. Stakeholders should be prepared to engage with OHCA through 2023 and 2024 as the Board sets key program parameters and definitions.

What it is. After years of negotiation between the California Legislature and health care organizations, in late June 2022, California’s Governor Newsom signed the California Health Care Quality and Affordability Act (Senate Bill 184) to establish OHCA within the California Department of Health Care Access and Information (HCAI). OHCA is charged with creating a state strategy for controlling the cost of health care, establishing a state cost growth benchmarking program, and supporting other market oversight activities. Specific responsibilities of the Office include:

What it means. Implementing SB-184 will require a multiyear process of defining and refining the benchmarking program’s design and respective requirements. Stakeholder engagement will be central to advancing the bill’s long-term goals, and stakeholders should keep in mind that:

Figure 1. Timeline and Key Milestones for OHCA Implementation

Fig-1-3-20-23.jpg
What happens next. California’s benchmarking program is more comprehensive and complex than any benchmarking program that has come before it. OHCA’s charge is sweeping, but much of its program was left to design through implementation. Stakeholders should be prepared to engage with OHCA through 2023 and 2024 as the Health Care Affordability Board sets key program parameters and definitions. Stakeholders should also remember that technical and seemingly small decisions can have major implications for benchmarking program design, implementation, and impact, and stakeholders should engage their associations and subject matter experts accordingly.

For more information, please see Manatt Health’s webinar A New Era of Accountability: Lessons From the CA Health Care Quality and Affordability Act or contact Kevin McAvey at kmcavey@manatt.com.

Manatt All-Payer Claims Database Summit Renews Congressional Interest in a National APCD

The takeaway. On December 7, 2022, with support from the Robert Wood Johnson Foundation (RWJF) and the Peterson Center on Healthcare, Manatt hosted the National All-Payer Claims Database (APCD) Summit, where public and private health care stakeholders offered support for the recommendations in Manatt’s report “Realizing the Promise of All Payer Claims Databases: A Federal and State Action Plan,” including the establishment of a national APCD and enhancing State Health Data Organizations (HDOs) funding. Following the Summit, Congressman Donald Beyer introduced the National All-Payer Claims Database Act of 2022 (H.R. 9644), which codified many of the paper’s recommendations—and renewed discussions on the Hill about the value of national health system transparency.

What it is. State APCDs are marketwide repositories of public and private payer health care claims and encounter data, including records of health care service payments that provide contextual information about the individuals served and their diagnosed conditions. State APCDs can provide users with broad and longitudinal cross-payer insights into health system performance and changing population health, and they are used by policymakers to inform health care and payment reform design as well as support market transparency.

The current state APCD operating model has several limitations that can constrain the use and usefulness of APCDs. Drawbacks include:

With support from the RWJF and the Peterson Center on Healthcare, Manatt Health engaged more than 40 federal and state policymakers, regulators, researchers, and other health data leaders to design and propose a new, national APCD model that would build on the existing state-based APCD infrastructure to strengthen national health system transparency. The proposed “Federally Facilitated State Data Partnership” model (see Figure 2) was presented at the December 2022 National APCD Summit.

Figure 2. Manatt Health’s Proposed National APCD Model: Federally Facilitated State Data Partnership
Fig-2-3-20-23.jpg

Key features of the Manatt-proposed model were included in Congressman Donald Beyer’s National All-Payer Claims Database Act of 2022, introduced on December 21, 2022.

What it means. If reintroduced and advanced in the House, Congressman Beyer’s bill would create new national health data capacity to support system transparency and decision-making, including:

1. Creating a National Health Data Organization (HDO) and National APCD. The bill directed the Secretary of Health and Human Services to contract with a nonprofit organization to establish and maintain a national health care claims database in accordance with federal data privacy laws as well as protections set by the HDO’s governing board. The National HDO would be housed within the Agency for Healthcare Research and Quality (AHRQ) and would collect data from participating state APCDs before filling data gaps with direct payer reporting. The National HDO would also be responsible for:

The National HDO would be governed by a board that comprises representatives from the federal government, participating states, employers, patient advocacy organizations, and academia who have data privacy and security expertise. The National HDO would be funded at $50 million annually.

2. Increasing Funding for State Health Data Organizations. The bill proposed the appropriation of $40 million annually—or $200 million over five years3—to provide states with funding to build health data capacity and test innovative approaches to health data use (Health Data Innovation Grants). State health data capacity funding of up to $36 million annually would be available to states to support the maintenance, establishment, or utilization of state APCDs. State Health Data Innovation Grants of no less than $4 million annually would also be provided to states to support state APCD analyses of potential national interest (e.g., analyses to support opioid use disorder responses or to test behavioral health network adequacy). Funding would be available to states participating in national database development.

3. Establishing National Health System Data Protections.The bill outlined data privacy and security requirements for the National HDO and its activities, including:

The National HDO, as proposed in Manatt’s paper but not explicitly called out in the bill, may also choose to require minimum data privacy and security standards of participating states, elevating APCD data protections nationally.

What happens next. Congressman Beyer’s bill would need to be reintroduced in the new Congress for further action to occur. However, its introduction has renewed federal (congressional and executive), state, and private sector interest in establishing a national APCD (or similar). Manatt will continue to track discussions and future legislative action. For more information, contact Kevin McAvey at kmcavey@manatt.com.


1 Including California (in progress), Connecticut, Delaware, Maine (in progress), Massachusetts, Nevada, New Jersey, Oregon, Rhode Island, and Washington.

2 Half of Americans are covered by employer-sponsored insurance (ESI), and nearly two-thirds (64%) of those are covered through self-insured plans. For more information, see “Health Insurance Coverage of the Total Population,” Kaiser Family Foundation. 2019. Accessed July 25, 2022. Available here. See also, “Employer Health Benefits: 2021 Annual Survey,” Kaiser Family Foundation. 2021. Accessed July 25, 2022. Available here.

3 H.R. 9644 appropriates $40 million annually for fiscal years 2023 through 2028. While no single state will be eligible to receive more than $10 million in grant funding in any year, multiple states seeking to jointly establish a regional APCD would not be subject to this grant funding limit.

To return to the Manatt State Cost Containment Update Home Page, please click here.


In this issue, Manatt examines how benchmarking programs can elevate the importance of primary care and behavioral health care investments and allow for the measurement of spending on these critical preventive services. A PDF of our update is also available here.

Leveraging State Benchmarking Programs to Drive Investments in Primary Care

The takeaway. State cost growth benchmarking programs support market transparency and accountability, and may be used to assess and redirect health care spending to higher-value, preventive services, such as primary and behavioral health care, through priority service targets.

What it is. States are increasingly seeking to both constrain health care cost growth as well as influence where health care dollars are being invested, with the goal of redirecting spending to high-value services and activities that support long-term population health, such as primary care.

While the U.S. far exceeds peer countries in health care spending—at $4.1 trillion or $12,530 per person in 20201—it continues to lag in terms of care access, administrative efficiency, equity and health care outcomes: There is a disconnect between how much the U.S. is investing in health and how much it is getting in return.2 Studies indicate that the disconnect may be attributable, in part, to where health care dollars are being invested. Studies of other Organization for Economic Cooperation and Development (OECD) countries indicate that stronger primary care systems, for example, are correlated with better population health outcomes, such as lower overall mortality rates, lower rates of premature death and lower hospitalizations for ambulatory care sensitive conditions,3 and higher infant birth weight, life expectancy and overall satisfaction with the health care system.4 Even within the U.S., communities with greater primary care availability have reported better patient outcomes as well as decreased utilization of more costly health service categories, such as inpatient hospitalizations and emergency department visits.5

States like Rhode Island and Delaware have long recognized the value of investments in primary care and successfully directed attention and spending through existing insurance regulatory authorities. Other states, such as Connecticut and Massachusetts, are testing how they may leverage their benchmarking programs as a mechanism for advancing broader primary care investment agendas.

In 2010, Rhode Island implemented Affordability Standards,6 which established annual price inflation caps and required regulated commercial insurers to spend at least 10.7% of their total health care spending on primary care services under the health insurance commissioner’s rate review authority.7 Insurer primary care spending subsequently increased from 5.7% in 2008 to 9.1% in 2012 and achieved the state-set target of 10.7% in 20148 before reaching 12.3% of total medical spending in 2018 (see Figure 1).9 A 2019 study found that the Affordability Standards increased aggregate primary care spending and saw reductions in total spending growth, with no impacts on health care quality.10

Figure 1. Primary Care Spending in Rhode Island, Total and as a Percentage of Total Medical Spending, 2008–2019
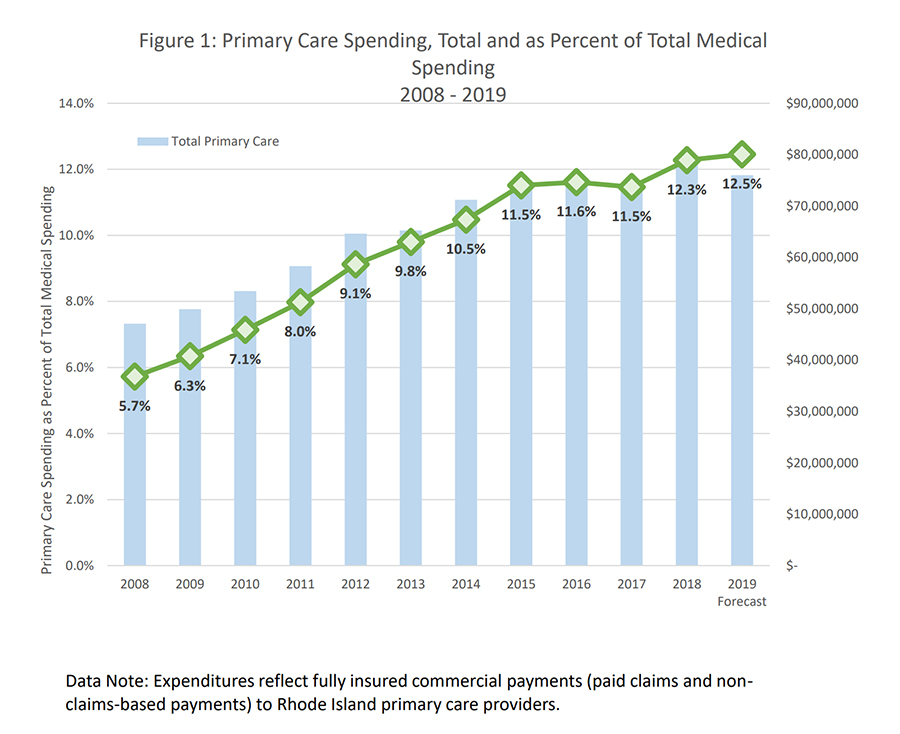
Fig-2-900x734.jpg
In 2020, Delaware’s Department of Insurance Office of Value Based Health Care Delivery (OVBHCD)11 proposed similar affordability standards, which the state is seeking to codify through its proposed Regulation 1322 Requirements for Mandatory Minimum Payment Innovations in Health Insurance.12, 13 The standards would, among other actions, set a target for commercial health insurers to increase investments in primary care14 by 1.5% annually, targeting an increase in primary care spending from 7% of total cost of care in rate filing year 2022 (plan year 2023) to 11.5% by rate filing year 2025 (plan year 2026).15, 16, 17

States may also advance primary care investment agendas through their existing benchmarking programs and processes.

The Challenge of Defining “Primary Care Services” to Support Spending Measurement

In 2018, the New England States Consortium Systems Organization (NESCSO) developed a standardized methodology for calculating all-payer primary care spending across six New England states—Connecticut, Maine, Massachusetts, New Hampshire, Rhode Island and Vermont—using each state’s respective all-payer claims database (APCD) data.18 NESCSO developed and tested the following definitions for primary care in its analysis:

  • “Defined PCPs, Selected Services,” which includes selected claims payments for general practice, family medicine, pediatrics, internal medicine, nurse practitioner and physician assistant and excludes OB/GYN services.
  • “Defined PCPs, All Services,” which includes all claims payments for the provider services listed in Definition 1 and continues to exclude OB/GYN services. This definition did not restrict service codes.
NESCSO found that the all-state average of primary care spending as a proportion of total medical spending ranged from 5.5% to 8.2%, depending on the definition used to capture primary care providers, services and spending. Primary care spending as a proportion of total spending was highest for the Medicaid population (8.0%–10.4% by state), followed by commercial (6.1%–9.3%), Medicare Advantage (5.5%–8.4%) and Medicare fee-for-service (3.4%–5.4%). See Figure 2 below for more detail. These findings align with other recent state studies that have examined total primary care spending.19

Figure 2. Primary Care Percentage of Total Medical Payments by Payer Type, 2018, NESCSO Study
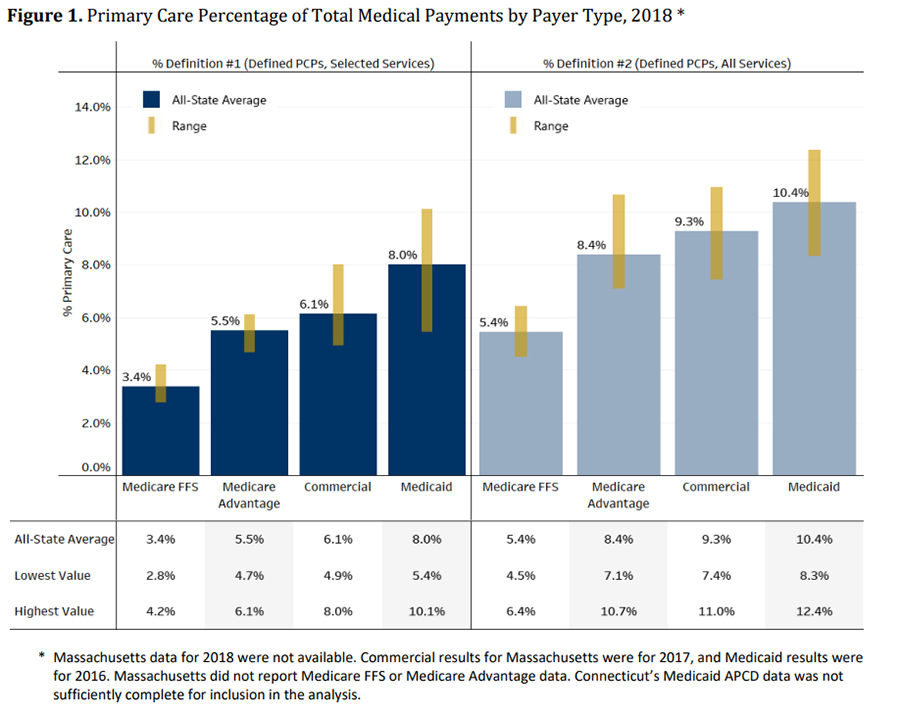

Fig-2-900x717.jpg

What it means. Health care cost growth benchmarking programs can provide states with a mechanism to similarly advance cost containment and “priority service” objectives, allowing stakeholders to measure and monitor primary care spending against total system spend and use this information to influence investments in preventive services.

State cost growth benchmarking programs are data-driven, transparency-focused cost-containment initiatives that measure resident health care spending growth in relation to established targets; payers and providers that exceed targets may be subject to public inquiry or penalty. States collect benchmarking data directly from public and private payers operating in their states, monitoring health care spending across all lines of business. Payers may be asked to segment spending data by service category (which may be expanded to include primary care services and other priority services), key populations or product types, attribute spending to providers who may influence patient service utilization, or supplement “core” reporting with contextual information.20 States are then able to analyze payer data to understand broad market health care spending trends, and to better target policy and program actions to address cost drivers—or, for “priority service” areas like primary care, advance agendas that displace lower-value spending with spending on services that promote long-term population health outcomes (see Figure 3 below).

Figure 3. Illustrative Example of Increased Investments in Primary Care and Impacts on Overall Health Care Cost Growth Over Time
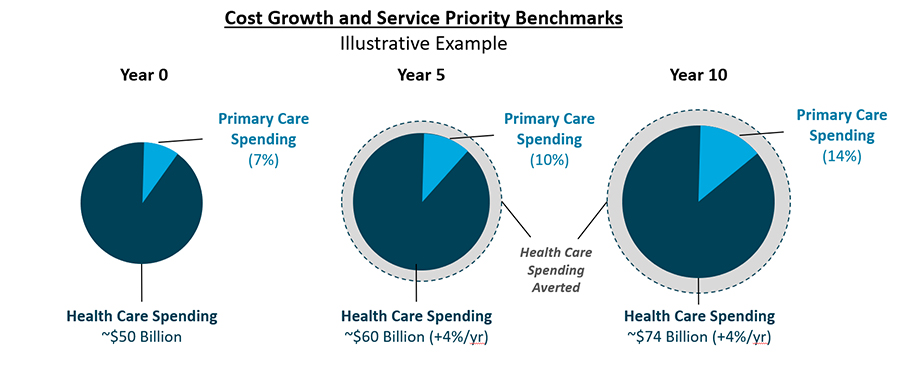
Fig-2-900x377.jpg

Connecticut. In 2020, Connecticut’s Governor Lamont issued Executive Order No. 5, which, in addition to establishing the statewide cost growth benchmark, also charged the Office of Health Strategy (OHS) with developing and recommending a primary care spending target for the state beginning in 2021 in order to reach a primary care spending target of 10% (as a percentage of total health care expenditures, or THCE) by 2025. OHS’ preliminary analysis of primary care spending in the state by market found that the state’s average primary care spending in 2019 was 5.3%, with the highest percentage of primary care spend within Medicaid (7.8%), followed by the commercial market (5.0%) and Medicare (4.2%) (see Figure 4). In December 2021, OHS adopted primary care spending targets of 5.3% for 2022, 6.9% for 2023, 8.5% for 2024 and 10% by 2025. OHS will collect primary care spending data from payers within their cost growth benchmark data submissions in late 2022.

Figure 4. Primary Care Spending as a Percentage of Total Spending in Connecticut, 2018 and 2019 21
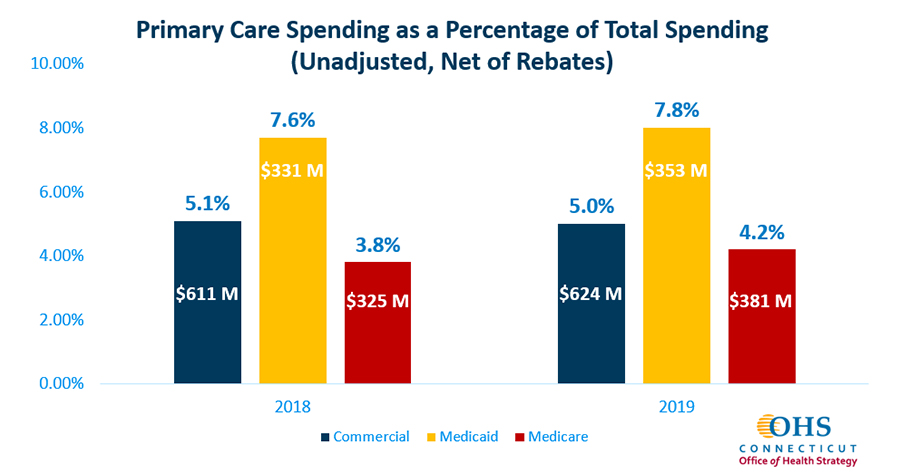
Fig-2-900x474.jpgMassachusetts. In March 2022, Massachusetts’ Governor Baker similarly filed “An Act Investing in the Future of Our Health” for the creation of a statewide aggregate primary care and behavioral health care spending target and set a goal of increasing spending on these services by 30% over three years while maintaining the state’s health care cost growth benchmark.22, 23 Payer and provider progress toward meeting spending targets will be assessed by the state’s Center for Health Information (CHIA) and Health Policy Commission (HPC) through its regular cost growth benchmark reporting process. Entities that fail to achieve the established primary care spending target may be required to complete a performance improvement plan (PIP) wherein they identify strategies to increase investments in primary care and behavioral health. The Baker-Polito Administration estimates this action will generate nearly $1.4 billion in systemwide investments for primary care and behavioral health services over the next three years.24

Other states pursuing benchmarking programs are also considering setting primary care and behavioral health priority service targets as part of their programs.25 California’s AB-1130, proposes establishing an Office of Health Care Affordability, a statewide cost growth benchmark, and priority service benchmarks for primary care and behavioral health investments.26

What happens next. As state cost growth benchmarking programs continue to proliferate and mature, more states will explore ways to leverage their data collection and reporting to advance local priorities, including increasing investments in preventive services like primary care and behavioral health.

To return to the Manatt State Cost Containment Update Home Page, please click here.


1 “NHE Fact Sheet,” Centers for Medicare & Medicaid Services. Available here: https://www.cms.gov/Research-Statistics-Data-and-Systems/Statistics-Trends-and-Reports/NationalHealthExpendData/NHE-Fact-Sheet

2 “Mirror, Mirror 2021: Reflecting Poorly—Health Care in the U.S. Compared to Other High-Income Countries,” The Commonwealth Fund. August 4, 2021. Available here: https://www.commonwealthfund.org/publications/fund-reports/2021/aug/mirror-mirror-2021-reflecting-poorly

3 M. Niti, T. Ng. “Avoidable hospitalisation rates in Singapore, 1991–1998: assessing trends and inequities of quality in primary care,” Journal of Epidemiology and Community Health. January 2003. Available here: https://www.ncbi.nlm.nih.gov/pmc/articles/PMC1732279/

4 J. Macinko, B. Starfield, L. Shi. “The Contribution of Primary Care Systems to Health Outcomes within Organization for Economic Cooperation and Development (OECD) Countries, 1970–1998,” Health Services Research. June 2003. Available here: https://www.ncbi.nlm.nih.gov/pmc/articles/PMC1360919/

5 C. Chang., T. A. Stukel, A. B. Flood, D. C. Goodman. “Primary Care Physician Workforce and Medicare Beneficiaries’ Health Outcomes,” JAMA. May 25, 2012. Available here: https://www.ncbi.nlm.nih.gov/pmc/articles/PMC3108147/

6 230-RICR-20-30-4.10 – Affordable Health Insurance – Affordability Standards. Current, effective June 2020. Available here: https://ohic.ri.gov/sites/g/files/xkgbur736/files/2022-03/230-ricr-20-30-4-final-sos.pdf

7 Equal to the Medicare price index plus one percentage point for both inpatient and outpatient services.

8 “Investing in Primary Care: A STATE-LEVEL ANALYSIS,” Patient-Centered Primary Care Collaborative, Robert Graham Center and Milbank Memorial Fund. July 2019. Available here: https://www.graham-center.org/content/dam/rgc/documents/publications-reports/reports/Investing-Primary-Care-State-Level-PCMH-Report.pdf

9 http://www.ohic.ri.gov/documents/2020/June/Primary%20Care%20Expenditure%20Data%20Update%20June%202020.pdf

10 A. Baum et al. “Health Care Spending Slowed After Rhode Island Applied Affordability Standards To Commercial Insurers,” Health Affairs. February 2019. Available here: https://www.healthaffairs.org/doi/10.1377/hlthaff.2018.05164

11 Established via Senate Bill 116, 150th General Assembly (2019–2020). Available here: https://legis.delaware.gov/BillDetail/47520

12 Office of Value Based Health Care Delivery (OVBHCD), Delaware Department of Insurance. Available here: https://insurance.delaware.gov/divisions/consumerhp/ovbhcd/

13 “1322 Requirements for Mandatory Minimum Payment Innovations in Health Insurance, Proposed Rule, Public Notice.” Department of Insurance, Office of the Commissioner. Available here: https://regulations.delaware.gov/register/january2022/proposed/25%20DE%20Reg%20684%2001-01-22.htm

14 Beginning in rate filing year 2022 (for plan year 2023).

15 “An Integrated Approach to Improve Access, Quality and Value,” OVBHCD, Delaware Department of Insurance. December 18, 2020. Available here: https://insurance.delaware.gov/wp-content/uploads/sites/15/2020/12/Delaware-Health-Care-Affordability-Standards-Report-12182020.pdf

16 “Delaware Sets Primary Care Investment Target,” Primary Care Collaborative. January 28, 2021. Available here: https://www.pcpcc.org/fr/node/209659

17 Delaware’s Affordability Standards also incorporated price caps for aggregate unit price growth for inpatient and outpatient hospital services through 2025 to contain health care cost growth.

18 “The New England States’ All-Payer Report on Primary Care Payments,” New England States Consortium Systems Organization (NESCSO). December 22, 2020. Available here: https://nescso.org/wp-content/uploads/2021/02/NESCSO-New-England-States-All-Payer-Report-on-Primary-Care-Payments-2020-12-22.pdf

19 “Investing in Primary Care, A State-Level Analysis,” Patient-Centered Primary Care Collaborative (PCPCC). July 2019. Available here: https://www.pcpcc.org/sites/default/files/resources/pcmh_evidence_report_2019.pdf

20 J. Ario, K. McAvey, A. Zhan. “State Benchmarking Models: Promising Practices to Understand and Address Health Care Cost Growth,” Manatt Health. June 2021. Available here: https://www.manatt.com/insights/white-papers/2021/state-benchmarking-models-promising-practices-to-u

21 “Leveraging State Benchmarking Models to Address Health Care Cost Growth,” Manatt Health webinar, April 2022. Available here: https://www.manatt.com/insights/webinars/leveraging-state-benchmarking-models-to-address-he

22 S. 2774, “An Act Investing in the Future of Our Health.” Filed March 17, 2022. Available here: https://malegislature.gov/Bills/192/S2774

23Calendar year (CY) 2019 will serve as the baseline year CY 2024 spending will be measured against.

24 “Baker-Polito Administration Files Health Care Legislation Aimed at Expanding Access to Care,” Press Release, Office of Governor Baker and Lt. Governor Polito. March 15, 2022. Available here: https://www.mass.gov/news/baker-polito-administration-files-health-care-legislation-aimed-at-expanding-access-to-care

25 “Groundbreaking Study Links Higher Primary Care Spending to Better Care Quality in California,” California Health Care Foundation. April 19, 2022. Available here: https://www.chcf.org/press-release/groundbreaking-study-links-higher-primary-care-spending-to-better-care-quality-in-california/

26 AB-1130, California Health Care Quality and Affordability Act (2021–2022 Regular Session). Introduced February 18, 2021. Available here: https://leginfo.legislature.ca.gov/faces/billNavClient.xhtml?bill_id=202120220AB1130

To return to the Manatt State Cost Containment Update Home Page, please click here.


In each edition, Manatt will feature a “deep dive” topic that shares new cross-cutting benchmarking program developments as states seek to evolve and advance their cost growth benchmarking programs to meet new regulatory and landscape needs. In this issue, Manatt examines opportunities for states to leverage All Payer Claims Databases (APCDs) and other key data assets to supplement state benchmarking programs. A PDF of our update is also available here.

Leveraging APCDs and Other Data Assets

The takeaway.  State benchmarking programs may leverage other data resources - including All Payer Claims Databases (APCDs), private claims databases, and federal and state survey data - to provide policy-makers, regulators, consumer advocates, and researchers with important context for findings (e.g., who bears burden of cost growth) and allow results to be as actionable as possible (e.g., specific providers or drugs contributing to cost growth). 

What it is. State cost growth benchmarking programs are data-driven, transparency-focused cost-containment initiatives that measure resident health care spending growth in relation to established targets; payers and providers that exceed targets may be subject to public inquiry or penalty.  States collect benchmarking data directly from public and private payers operating in their states, monitoring health care spending across all lines of business.  Payers may be asked to segment spending data by service category, key populations or product types, attribute spending to providers who may influence patient service utilization, or supplement “core” reporting with contextual information such as premium cost growth, Alternative Payment Methodology (APM) adoption rates, and member cost-sharing growth to help states better understand cost drives across payers and populations.  Payer submissions, typically delivered in a set of summative tables with aggregate data (i.e., not person-level information), are sourced from a combination of their administrative (claims/encounter) data and financial data (non-claims-based payments), to present a complete, timely, and verifiable accounting of health care spend.  Payers may be required to have an accountable person at their organization (e.g., CEO, chief actuary) certify that the data presented is valid to the best of their knowledge.

States may also use All Payer Claims Databases (APCD) to better understand health care market cost trends.  APCDs are large-scale databases that collect health care claims and encounter data from public and private payers across most lines-of-business, with the notable exceptions of the private self-insured (unless voluntarily reported) and Medicare fee-for-service (unless manually integrated by the state from CMS files).1 Claims/encounter data can be a rich source of information, including person-level detail on patient diagnosis, the service delivered, the provider delivering the service, and the amount paid for delivery, by both the payer and patient. APCDs also collect other administrative information from payers to supplement and contextualize claims data, including enrollee demographic characteristics (e.g., age, zip code), and characteristics of enrollees’ coverage types and details (e.g., network characteristics, plan premiums). APCDs can provide health services researcher with large sample sizes, person-, provider-, and service-level detail, and the ability to following patient populations/panels over time (i.e., longitudinal information), making them valuable and powerful – if at times unwieldy – data assets.2

Unfortunately, APCD data cannot replace payer benchmarking data reporting, a common myth in health data circles, for reasons including that APCD data:

  • Does not include non-claims payment information, which is of increasing importance as more payers and providers are paid under APMs;
  • Does not include the vast majority of ERISA-preempted self-insured claims data (self-insured lives typically comprise over 60% of the employer-sponsored insurance market);
  • Is not as timely as benchmarking data files, with calendar year benchmarking data received as soon as five months after year-end with payer-provided incurred but not reported (IBNR) estimates; and
  • Does not have payer verification of results – or the methods used to derive them.

However, benchmarking and APCD data analyses can be paired to great effect:  with benchmarking data uniquely capable of identifying cross-market concerns, while APCD data can be used to add context and detail to findings, making them that much more actionable for policy-makers, regulators, advocates, and researchers. 

Figure 1. Benchmarking Data vs. APCD Data

What it means. While benchmarking data can provide important insights into aggregate, year-over-year cost growth trends by state, payer, provider (often), service category, and population group, states can derive additional insights by pairing benchmarking data and findings with analyses of other data assets, such as APCDs.6 Six of the eight states that have a benchmarking program, or have one actively in development, also have an APCD - including Washington, Oregon, Massachusetts, Delaware, Connecticut and Rhode Island – though analytic coordination across the two data assets varies considerably.7 

Figure 2. Current State of APCD Implementation as of February 2022

Massachusetts has used its APCD, as well as other data assets it stewards, such as the Massachusetts Health Insurance Survey (MHIS), to support the state’s broader cost trends evaluations and hearings. For example, in 2021, the Massachusetts Health Policy Commission (HPC) used state benchmarking data to identify hospital outpatient spending as the fastest-growing service category for the commercial market, followed by spending on physician services and other professional services (Figure 3).8, 9

The HPC then leveraged other available data to better understand the equity implications of cost growth:  pairing service category trends with information on who bears the costs.

Using commercial claims data from the Massachusetts APCD, the HPC found that individuals in the highest-income quintile had a higher proportion of their overall health care spending concentrated in hospital outpatient and professional services, whereas individuals in the lowest-income quintile had a higher proportion of their spending concentrated on prescription drugs, inpatient services, and emergency department (ED) services (Figure 4). These findings – made possibly only by linking benchmarking data with other available data resources - highlighted an important disparity in individuals’ access and utilization of health care services by income for policymakers and regulators consideration.

Figure 3. Percentage annual growth in spending per commercial enrollee, 2016-2019.10 

Figure 4. Percent of health care spending by category and income for commercially insured adults by lowest- and highest-income quintile, 2018. 11

State APCD Use Cases

APCDs have been used to support numerous use cases across the 18 states that presently host them.  They may be used by policy-makers, regulators, consumer advocates, researchers, and other stakeholders to:  better understand health care spending and utilization by payer, provider, and population group; answer specific policy and research questions (e.g., potential impact of Medicaid expansion); support public health monitoring, population health assessments, and cross-payer quality measurement initiatives; increase health system and cost transparency; and guide purchasers in decision-making.12

Massachusetts’ HPC uses the state’s APCD to expand upon benchmarking-related topics and issues, including to:13

  • Analyze out-of-pocket costs for commercial insured populations,14 including copayments, co-insurance, and deductibles for both medical and prescription spending among the commercially insured using APCD data. The HPC found that from 2015-2017, average annual OOP spending for the commercially insured grew about 20%, from $601 to $721. Within that average annual OOP spend, APCD data provided additional clarity on who faced the cost of increasingly high OOP spending by examining the distribution of the annual OOP spend: while half of all members spent $345 or less OOP annually, individuals at or above the 90th percentile of OOP spending in all three years spent nearly ten times more, or nearly $3,499 on average, in comparison.
  • Analyzing telehealth visits among commercially insured residents in 2015-2017,15 which examined telehealth visits using commercial claims data from the Massachusetts APCD. This analysis found that the rate of telehealth utilization among commercially-insured patients in Massachusetts almost doubled between 2015 and 2017, from 2.0 visits per 1,000 members in 2015 to 4.0 visits per 1,000 members in 2017 – even prior to the pandemic -  a finding that mirrors trends observed in a similar national commercially-insured population.  The investigation only added context to future benchmarking discussions around patient access, service utilization, and cost.

While having an APCD allows for more robust analyses of heath care trends, states may also use private claims data assets – such as data from the Health Care Cost Institute (HCCI) or FAIR Health - to better understand their health care spending trends.

State-level survey data has been widely used by states to understand health care cost growth and consumer affordability, including Massachusetts, Oregon, and Connecticut. For example, Connecticut paired American Community Survey (ACS) data with APCD data to create the Connecticut Healthcare Affordability Index (CHAI), a tool for policymakers and consumers to better understand the growing burden of rising health care costs for Connecticut families. The CHAI used data from the Connecticut APCD to calculate out-of-pocket costs for families with employer-sponsored and individual marketplace insurance by town, county, age group, gender, and health risk score.16

States may also use the Medical Expenditure Panel Survey (MEPS) Insurance Component (IC), which fields questionnaires to private and public sector employers to collect data on the number and types of private health insurance plans offered, benefits associated with these plans, annual premiums, annual contributions by employers and employees, eligibility requirements, and employer characteristics.17 For many states that do not have health insurance premium reporting as part of their benchmarking data collection process, the MEPS-IC provides similar premium cost growth data – though with a lag of at least two years – that provides insight into how employees and employers are directly confronting cost growth in local markets.

What happens next. As benchmarking programs continue to proliferate and mature, additional opportunities will emerge to examine how states are pairing their data with other assets to reinforce findings and other, novel use cases.

To return to the Manatt State Cost Containment Update Home Page, please click here.


APCD Council, FAQs. Available here: https://www.apcdcouncil.org/frequently-asked-questions

2 “Overview of All-Payer Claims Databases,” Agency for Healthcare Research and Quality. Available here: https://www.ahrq.gov/data/apcd/index.html

3 “Annual Report on the Performance of the Massachusetts Health Care System (October 2019),” Massachusetts Center for Health Information and Analysis (CHIA). October 2019. Available here: https://www.chiamass.gov/assets/2019-annual-report/2019-Annual-Report.zip   

4 Interactive Dashboard, Top 20 Drugs in 2015: Total Expenditures. Commercial Prescription Drug Use & Spending, 2015-2017, Massachusetts Center for Health Information and Analysis (CHIA). February 2020. Available here: https://www.chiamass.gov/prescription-drugs/#prescription-dashboard

5 CHIA data set used does not reflect the impact of prescription drug rebates. Also does not include spending for drugs or administration of drugs covered under a medical benefit.

6 Other informative data assets that states have used include hospital discharge data, payer expenditure reports, provider financial reports, and surveys of employers and households.

7 Nevada is planning for APCD development, pending the release of federal funds to support establishment.

8 “2021 Annual Health Care Cost Trends Report,” Massachusetts Health Policy Commission (HPC). September 2021. Available here: https://www.mass.gov/doc/2021-health-care-cost-trends-report/download

9 Other informative data assets that states have used include hospital discharge data, payer expenditure reports, provider financial reports, and surveys of employers and households.

10 Data source: Payer reported TME data to CHIA and other public sources; HPC analysis of data from Center
for Health Information and Analysis Annual Report, March 2021.

11 Data source: HPC analysis of Massachusetts APCD, 2018.

12 D. McCarthy, “STATE ALL-PAYER CLAIMS DATABASES: Tools for Improving Health Care Value. Part 2: The Uses and Benefits of State APCDs,” The Commonwealth Fund. December 2020. Available here: https://www.commonwealthfund.org/sites/default/files/2020-12/McCarthy_State_APCDs_Part2_v2.pdf

13 Health Policy Commission (HPC) DataPoints Series. Available here: https://www.mass.gov/service-details/health-policy-commission-hpc-datapoints-series

14 “DataPoints Issue 19: Persistently High Out-of-Pocket Costs Make Health Care Increasingly Unaffordable and Perpetuate Inequalities in Massachusetts,” Massachusetts Health Policy Commission (HPC). Jan. 13, 2021. Available here: https://www.mass.gov/info-details/hpc-datapoints-issue-19-persistently-high-out-of-pocket-costs-make-health-care.

15 “DataPoints Issue 16: The Doctor Will (Virtually) See You Now,” Massachusetts Health Policy Commission. March 12, 2020. Available here: https://www.mass.gov/info-details/hpc-datapoints-issue-16-the-doctor-will-virtually-see-you-now

16 L. Manzer and D. M. Pearce, “Connecticut Healthcare Affordability Index,” prepared for the Connecticut Office of Health Strategy and Connecticut Office of the State Comptroller. December 2020. Available here: https://portal.ct.gov/-/media/OHS/CT-Healthcare-Affordability-Index/CHAI/CT-Healthcare-Affordability-Index.pdf

17 The Medical Expenditure Panel Survey, Insurance/Employer Component. Agency for Healthcare Research and Quality. Accessed December 22, 2021. Available here: https://meps.ahrq.gov/survey_comp/Insurance.jsp

To return to the Manatt State Cost Containment Update Home Page, please click here.


In each edition, Manatt will feature “deep dive” topics that share new cross-cutting benchmarking program developments as states seek to evolve and advance their cost growth benchmarking programs to meet new regulatory and landscape needs. In this issue, Manatt examines recent program changes in the following areas:

  • Accountability: As payers and providers exceed set health care cost growth targets, there is a growing interest in how to hold outliers accountable. Massachusetts and Oregon are pursuing varying approaches to advancing accountability.
  • Consumer Affordability: Beyond addressing aggregate spending, states are focusing on how consumers bear the burden of rising health care costs. Massachusetts and Connecticut are leveraging important tools to better understand how rising health care costs impact consumers.

A PDF version of our October Spotlight is available here.

Accountability

The takeaway. State cost growth benchmarking programs are building on their market reporting to more rigorously define unjustified spending growth and what actions states should take to address entities driving such growth.

What it is. State cost growth benchmarking programs collect health care data that can help policymakers, regulators and stakeholders better understand the cost centers and cost drivers in their markets. Programs include a cost growth benchmark that annual health care cost growth should not exceed. States have a continuum of mechanisms for holding payers and providers accountable for unjustified spending above benchmarks, as illustrated in Figure 1. Where spending exceeds benchmarks, states are discussing two issues: First, how do we identify cases where the excess spending merits more aggressive action than public transparency? Second, what kind of escalating actions are appropriate to address unjustified spending above the benchmark?

Figure I. The Continuum of Benchmarking Accountability Mechanisms

What it means. Three states exceeded their cost growth benchmarks during 2019: Delaware, Massachusetts, and Rhode Island – by 4.0, 1.2, and 0.9 percentage points, respectively.1,2,3 While all three programs have largely relied on public transparency to support cost growth containment, the tactic alone has not been a powerful enough deterrent to keep overall cost growth beneath established thresholds, spurring reviews of how excessive cost growth is identified and can be responded to.

States are exploring strategies to better understand cost drivers and refine the methods they use to identify unjustified or excessive cost growth. For example, Massachusetts has traditionally assessed entity accountability to the cost growth benchmark on a “health status”-adjusted basis, generally holding entities accountable for factors over which they have more influence: health service utilization (by working with individuals to identify conditions and health needs earlier) and health service prices (by negotiating contracts that hold service spending growth beneath required levels and steering patients to more appropriate, lower-cost service settings where possible). But cost growth due to the changing health of members (i.e., illness burden and expected resource use) has been largely exempt from measurement, with payers providing health status-adjusted growth rates in their reporting.

However, recent analyses by the Massachusetts Health Policy Commission (HPC) identified unexplained inflation in payer-provided health status adjustment values – potentially caused by changing methodologies, upcoding of health status indicators, or broader improvements in health status indicators (i.e., stronger identification of previously observed but not recorded population health concerns) – and likely indicating chronic and continual underassessment of cost growth against which individual payers and providers should be held accountable. The HPC is assessing whether to modify health status adjustment methodology requirements or base future payer/provider accountability against unadjusted cost growth measures.  

Figure II. Total Unadjusted Spending Growth in Massachusetts, 2013-20194

Oregon, similarly grappling with the question of when excess spending should spur enforcement, has proposed a different approach. The Oregon Implementation Committee Recommendations Report recommended statistical criteria for determining whether payers and providers in Oregon would be subject to certain accountability measures.5 These include:

  • In any given year, per capita cost growth exceeds the cost growth benchmark with 95% confidence; or
  • Across two consecutive years, per capita cost growth exceeds the benchmark in both years with 80% confidence; or,
  • For three out of five consecutive years (each independently assessed), per capita cost growth exceeds the cost growth target with 80% confidence.

Entities that “unreasonably” exceed the cost growth target during any performance year with statistical certainty for one or more markets would be automatically subject to a performance improvement plan (PIP). Connecticut’s Cost Growth Benchmark Technical Team has similarly recommended incorporating into its own cost growth benchmark a statistical methodology for determining entity accountability.6

Oregon’s HB 2081 builds on the accountability recommendations articulated in the Recommendation Report.7 This includes charging the Oregon Health Authority (OHA) with adopting rule criteria for imposing financial penalties for entities that exceed the cost growth target “without reasonable cause” in three out of five calendar years beginning in 2026, as part of the “escalating accountability mechanism” recommended by the Implementation Committee. The law does not specify the financial penalty amount, but does specify that it must be based on “the degree to which the provider or payer exceeded the target and other factors,” including but not limited to:

(a) The size of the provider or payer organization;
(b) The good faith efforts of the provider or payer to address health care costs;
(c) The provider’s or payer’s cooperation with the authority or the department;
(d) Overlapping penalties that may be imposed for failing to meet the target, such as requirements relating to medical loss ratios; and
(e) A provider’s or payer’s overall performance in reducing cost across all markets served by the provider or payer.

The law also sets new financial penalties of up to $500 per day for entities that fail to report cost growth data and/or fail to develop and implement a PIP if required.

Even in states with accountability measures already incorporated into their benchmarking programs, holding specific entities accountable for exceeding cost growth has not been widespread. For example, while Massachusetts’ HPC has the authority to impose PIPs and financial penalties of up to $500,0008 under Chapter 224 of the Acts of 2012, it has not yet exercised either option, though it has indicated an increasing willingness to do so.9 Notably, the HPC’s 2021 Annual Cost Trends Report puts forth a recommendation that demonstrates a willingness to increase accountability and address excessive provider price increases by establishing price caps for the highest-priced providers in the state.10


1 Delaware’s per capita cost increased from $7,814 in 2018 to $8,424 in 2019, or 7.8% – more than twice as high as the 3.8% target. Available here: https://news.delaware.gov/2021/04/01/state-releases-first-health-care-benchmark-trend-report-for-201/#:~:text=Latest%20Step%20in%20Effort%20to,Quality%20of%20Care%20in%20Delaware&text=The%20per%2Dcapita%20cost%20increased,high%20as%20the%203.8%25%20target.

2 From 2018 to 2019, the per capita growth in total health care expenditures in Massachusetts was 4.3%, exceeding the health care cost growth benchmark of 3.1% set by the HPC. Available here: https://www.mass.gov/info-details/health-care-cost-growth-benchmark.

3 Rhode Island’s per capita health care spending grew 4.1% between 2018 and 2019, exceeding the state’s 3.2% health care cost growth target. Available here: http://www.ohic.ri.gov/documents/2021/April/Cost%20Trends/steering%20committee%20meeting%202021%204-29%20for%20sharing.pdf.

4 “The Next Evolution of Healthcare Cost Growth Benchmarking Models,” NAHDO 36th Annual Conference. Presented September 28, 2021. Chart sources: Massachusetts CHIA TME databooks.

5 “Oregon Implementation Committee Recommendations Report,” Oregon Health Authority. January 25, 2021. Available here: https://www.oregon.gov/oha/HPA/HP/HCCGBDocs/Cost%20Growth%20Target%20Committee%20Recommendations%20Report%20FINAL%2001.25.21.pdf.

6 Cost Growth Benchmark Technical Team February 21, 2021, Meeting Notes, stating “the Technical Team recommended that OHS perform calculations of statistical significance when reporting benchmark performance to ensure the accuracy of findings,” Connecticut Office of Health Strategy. Available here: https://portal.ct.gov/-/media/OHS/Cost-Growth-Benchmark/CGB-TT-Information/CGB--TT-Meetings-2021/February-22-2021/CT-OHS---Technical-Team-Meeting---Minutes-2021-2-22.pdf.

7 House Bill 2081. Available here: https://olis.oregonlegislature.gov/liz/2021R1/Downloads/MeasureDocument/HB2081/Enrolled.

8 Under Chapter 224 of the Acts of 2012, if the HPC determines a health care entity has willfully neglected to file a PIP, failed to file an acceptable PIP in good faith, failed to implement the PIP in good faith, or knowingly failed to provide or falsified information required by the HPC, the HPC may assess a civil penalty to the health care entity of up to $500,000 as a last resort.

9 “As premiums rise, Health Policy Commission mulls adding accountability measures,” MetroWest Daily News. July 15, 2021. Available here: https://www.metrowestdailynews.com/story/news/2021/07/15/massachusetts-family-health-insurance-premiums-21-424-average-2019/7977321002/.

10 2021 Annual Cost Trends Report, Massachusetts Health Policy Commission. September 2021. Available here: https://www.mass.gov/doc/2021-health-care-cost-trends-report/download

Consumer Affordability

The takeaway. States are increasingly interested in understanding not only what is driving health care cost growth, but also how consumer costs are being impacted by that growth. States, however, should proceed carefully in developing new measures for consumer cost growth, ensuring that data is collected and reported with appropriate context.

What it is. Beyond addressing aggregate health care cost growth, states are increasingly turning their attention to understanding who is ultimately bearing the burden of rising health care costs. In particular, states are exploring new strategies to better understand and address the increases in consumer cost-sharing (e.g., deductibles, coinsurance, copays) that make access to care challenging even for consumers who have health coverage.

Nationally, from 2010 to 2020, the average premiums for families with employer health coverage increased by 55% and average deductibles among all covered workers increased by 111%, as health plans frequently cost more to cover less.1 Health care spending continues to consume a greater share of employee wages, which have only grown by 27% over the same period.2 Further, trends show that enrollment in high deductible health plans (HDHPs) has increased significantly since the passage of the Affordable Care Act (ACA), and these plans are shown to be associated with a significant reduction in preventive care and office visits, which in turn leads to a reduction in both appropriate and inappropriate care for consumers.3 Additionally, while HDHP enrollment has increased steadily over time across all racial and income groups, studies show that Hispanic and Black HDHP enrollees are significantly less likely to have a health savings account (HSA) to offset the costs of such high deductibles compared with their non-Hispanic White counterparts.4 These trends indicate not only that consumers are increasingly bearing the burden of overall health care system spending growth, but also that shifting costs onto consumers is not necessarily an effective strategy for reducing overall spending growth and has significant implications for health access and equity.

What it means. Benchmarking programs offer an important opportunity for states to build on established reporting capabilities and authorities in order to gather additional information on consumer affordability and examine its impacts. For example, Massachusetts collects supplemental reporting on consumer premiums and out-of-pocket (OOP) costs as part of its cost growth benchmark in order to identify trends and changes over time. In the 2021 Annual Report on the Performance of the Massachusetts Health Care System, the state reported that member cost-sharing and premiums increased at a faster rate than wages and inflation between 2017 and 2019, and the percentage of members that had an OOP maximum of at least $5,000 increased from 35.5% in 2017 to 43.9% in 2019.5

Oregon’s Implementation Committee Recommendations Report also recommended the state’s annual health care cost trend report discuss the market’s performance relative to the cost growth target as well as its implications for consumers, including:6

  • Premium growth;
  • Benefit levels;
  • Consumer OOP spending;
  • Quality of care (process, outcome, patient experience);
  • Access to care; and
  • Health care disparity and health care inequity.

Oregon has also recommended annual reporting of other potential unintended consequences, including employer spending, clinician satisfaction, workforce impacts, and consolidation impacts.

Both Washington and Connecticut have proposed embedding consumer affordability into their benchmarking design, tying a portion of benchmark value to median wage growth. Washington’s Health Care Transparency Board is proposing a 30/70 hybrid of the state’s potential gross state product (PGSP) and historical median wage, which would yield a benchmark value of 3.2% for 2022 and 2023.7 Connecticut is using a 20/80 weighting of PGSP and median income, with an add-on factor that grades down over time from 2021 to 2025, yielding a benchmark value of 3.4% in 2021, 3.2% in 2022, and 2.9% for 2023-2025.8 By incorporating wages into the statewide benchmark, these states are reinforcing that health care costs should not be growing faster than consumer finances and the state economy. 

Additionally, the Connecticut Office of Health Strategy (OHS) and the Office of the State Comptroller (OSC) have developed a companion measure to the state’s cost growth benchmark reporting – a Healthcare Affordability Index to measure the impact of health care costs (including premiums and OOP costs) on a household’s ability to afford basic needs.9 The Index establishes an affordability threshold for families’ health care spending of approximately 7%-11% of their household expenses, depending on family size.10 This tool was developed to help policymakers understand the impact of health care cost growth on households, and shows that as of June 2021, approximately 18% of households in Connecticut with working adults face costs that exceed the target for affordability.11 When paired with results from the state’s cost growth benchmark reporting process, Connecticut will have greater insight into not only how overall health care spending is trending over time but also how much of this cost is falling directly to consumers, and how many consumers are facing potentially untenable costs.

What happens next. With increasing interest in monitoring consumer cost burden within cost growth benchmarking programs, states are considering how to:

  • Incorporate a consumer cost growth measures into their cost growth benchmark data collection and reporting processes;
  • Build consumer income growth data into their benchmark threshold; and/or
  • Build separate “companion” data collection and reporting processes to assess consumer affordability.

For example, in Massachusetts, consumer advocates recently introduced the More Affordable Care (MAC) Act (H. 1247/S. 782),12 which, among other provisions, seeks to create a health care consumer cost growth benchmark for OOP and premium cost growth, in which payers and providers accountable to the statewide benchmark would further be held accountable to a cost growth target for consumer premiums and OOP spending. The state legislature recently held a hearing for the MAC Act, which is now pending a committee recommendation.

Further, in the Massachusetts HPC’s 2021 Annual Cost Trends Report,13 consumer affordability was emphasized as an urgent issue for state action. The HPC recommended the state strengthen accountability for consumer cost growth, including developing population-specific affordability standards; incorporating standards into rate review; supporting efforts to improve the consumer health plan shopping experience; and strengthening benefit design and advancing designs that may serve as alternatives to HDHPs.

While consumer benchmarks – like those proposed in Massachusetts – can provide states with a concrete metric to monitor the impacts of cost growth on consumer affordability, their operationalization and interpretation can present issues that should be considered in advance of implementation. For example, many state benchmarking programs are presently collecting aggregate “total” spending data from payers across various segmentations (e.g., market sector, line of business, geography) without distinction between payer- and consumer-paid amounts. Requiring further parsing of these amounts has the potential to double the size of existing payer data requests. Consideration should be given to both use cases and reporting burden before implementation. 

Further, measures of consumer burden should be presented with appropriate context to ensure proper interpretation. For example, many cost containment advocates have advanced benefit designs that incentivize consumer choice, including the adoption of consumer-directed HDHPs with HSAs and health reimbursement accounts (HRAs). Higher HDHP adoption, resulting in higher observed consumer spending, should be paired with consideration of:

  • Corresponding declines in premiums;
  • Potentially lower overall cost growth resulting from newly incented “price shopping” behavior (where observed); and
  • The limitations of state cost growth benchmarking programs’ data collection.

States – and the payers that provide them with data – typically do not have HSA/HRA reimbursement data, and to the extent that employers contribute to HRAs, collected data could potentially result in an overstatement of how much consumers are directly paying in OOP costs.

States seeking to address cost growth through a benchmarking program recognize that to address a problem is to first understand its scope. Being equipped with the right information is critical for ultimately developing strategies that can ensure containing cost growth does not come at the expense of consumer affordability or otherwise exacerbate health inequities. 


1 “2020 Employer Health Benefits Survey,” Kaiser Family Foundation. October 8, 2020. Available here: https://www.kff.org/report-section/ehbs-2020-summary-of-findings/.

2 “Average Family Premiums Rose 4% to $21,342 in 2020, Benchmark KFF Employer Health Benefit Survey Finds,” Kaiser Family Foundation. October 8, 2020. Available here: https://www.kff.org/health-costs/press-release/average-family-premiums-rose-4-to-21342-in-2020-benchmark-kff-employer-health-benefit-survey-finds/.

3 https://www.healthaffairs.org/doi/pdf/10.1377/hlthaff.2017.0610.

4 Ellison J., Shafer P., and Cole M.B. “Racial/Ethnic And Income-Based Disparities In Health Savings Account Participation Among Privately Insured Adults,” Health Affairs. November 2020.

5 “2021 Annual Report on the Performance of the Massachusetts Health Care System,” Massachusetts Center for Health Information Analysis. March 2021. Available here: https://www.chiamass.gov/assets/2021-annual-report/2021-Annual-Report.pdf.

6 “Oregon Implementation Committee Recommendations Report,” Oregon Health Authority. January 25, 2021. Available here: https://www.oregon.gov/oha/HPA/HP/HCCGBDocs/Cost%20Growth%20Target%20Committee%20Recommendations%20Report%20FINAL%2001.25.21.pdf.

7 The Washington Health Care Transparency Board recommended the state set its benchmark value using a 70/30 hybrid of the state’s historical median wage and PGSP, yielding a benchmark value of 3.2% beginning in 2023. Available here: https://www.hca.wa.gov/assets/program/hcctb-board-book-20210914.pdf.

8 “Cost Growth/Quality Benchmarks/Primary Care Target,” Office of Health Strategy. Available here: https://portal.ct.gov/OHS/Services/Cost-Growth-Quality-Benchmarks-Primary-Care-Target.

9 “Healthcare Affordability Index,” Connecticut Office of Health Strategy. Available here: https://portal.ct.gov/healthscorect/Affordability-Index?language=en_US.

10 The affordability target was based on the 2019 Connecticut Self-Sufficiency Standard report, which found that, depending on composition, households spend between 6% and 10% of their budget on health care costs, including premiums and OOP expenses.

11 “Healthcare Affordability Index Executive Summary,” Connecticut Office of Health Strategy. June 2021. Available here: https://portal.ct.gov/healthscorect/-/media/HealthscoreCt/CHAI-Executive-Summary-OHS_OSC_June_2021.pdf.

12 Senate Bill 782 (2021). Available here: https://malegislature.gov/Bills/192/S782

13 2021 Annual Cost Trends Report, Massachusetts Health Policy Commission. September 2021. Available here: https://www.mass.gov/doc/2021-health-care-cost-trends-report/download

To return to the Manatt State Cost Containment Update Home Page, please click here.

  • California Gets Rolling: Health Care Affordability Board Appointed and Set to Convene on March 21, 2023
  • Manatt All-Payer Claims Database Summit Renews Congressional Interest in a National APCD
    • Establishing Governance. Within OHCA, an eight-member Health Care Affordability Board comprised of people appointed by the Governor, the Senate Committee on Rules, the Speaker of the Assembly, the Secretary of Health and Human Services, and the CalPERS Chief Health Director will serve as a key decision-making body for California’s cost growth benchmarking program. The Board will also establish a Health Care Affordability Advisory Committee comprised of industry stakeholders, including representatives of consumer and patient groups, payers, fully integrated delivery systems, hospitals, organized labor, health care workers, medical groups, physicians, and purchasers. The Board may also choose to establish other technical/advisory committees to advise the Board’s decision-making.
    • Developing Cost Growth Targets. The Health Care Affordability Board is charged with establishing a statewide cost target on total health care spending, as well as specific targets by health care sector, geographic region, and health care entity as appropriate. The statewide cost target will be determined by the Board and set annually beginning in 2025,2 while specific targets by sector, by geographic region, and, potentially, by individual entity will be set beginning in 2028. Targets may incorporate economic or population-based measures; will account for baseline health care costs, historical trends, and other relevant data; and should be “predictable and sustainable” and set in accordance with a Board-approved, transparent methodology.
    • Measuring System Performance. OHCA will annually collect and analyze data from public and private payers to monitor health care spending across all lines of business in the state and assess statewide performance against established and approved cost growth targets. OHCA will supplement benchmarking data collection and measurement with additional HCAI data, such as hospital payment data, health care workforce data, hospital financial reporting data, and Health Care Payments Data (HPD, the state’s APCD).

      OHCA will develop a baseline report by June 1, 2025 (using 2022 and 2023 calendar year data) and its first annual report (using 2024 and 2025 calendar year data) on health care spending trends and underlying cost drivers by June 1, 2027, along with policy recommendations to control costs, improve quality performance, and advance equity of the health care system. Recommendations will ensure access to care and high-quality jobs while preserving workforce stability. At least 30 days after posting the annual report, OHCA will present the report at a public meeting of the Board to inform policymakers and the broader public about its findings, including actionable recommendations for mitigating cost growth.
    • Fostering Target Compliance. Beginning in 2026, OHCA may start to take progressive actions against health care entities for failing to meet the cost targets. If entity-attributed cost growth is found to be in excess of the target, OHCA may provide technical assistance to the entity, require public testimony from the entity, require submission and implementation of a performance improvement plan (PIP), and/or impose administrative penalties “in amounts initially commensurate with the failure to meet the targets, and in escalating amounts for repeated or continuing failure to meet the targets.”

      OHCA may also establish requirements for health care entities that wish to file for a waiver of enforcement actions due to circumstances that are outside the entity’s control or for entities that provide other sufficient reasons for being unable to meet cost targets.
    • Providing Additional Market Oversight. OHCA will seek to promote competitive markets in California by examining and analyzing the impact of market changes in a manner supportive of the efforts of the Attorney General (AG), the Department of Managed Health Care, and the California Department of Insurance. Beginning April 1, 2024, health care entities will be required to provide written notice of certain agreements or transactions 90 days in advance of the agreement or transaction taking place. OHCA is also granted oversight to prospectively examine and conduct cost and market impact reviews (CMIRs) of proposed consolidations and other similar transactions that may have “ a risk of significant impact on market competitions, the state’s ability to meet cost targets, or costs for purchasers and consumers.” Upon CMIR completion, OHCA will issue a preliminary report of its findings, to which affected parties and the public can respond, and may refer findings to the AG for further review of unfair methods of competition, anticompetitive behavior, or anticompetitive effects.
    • Encouraging Market Transformation. SB-184 advances a comprehensive benchmarking program that extends beyond core expenditure measurement and reporting to include:

      a. Quality and Equity. SB-184 includes a specific emphasis on maintaining a quality and equity lens in carrying out the functions of OHCA and establishing a single set of standard measures to report on quality and equity performance across payers, fully integrated delivery systems, hospitals, and physician organizations.

      b. Alternative Payment Models. OHCA will promote a shift from fee-for-service to alternative payment models by adopting alternative payment model standards for use during payer-provider contracting by July 1, 2024. OHCA will establish benchmarks to increase the proportion of care delivered through alternative payment models.

      c. Primary Care and Behavioral Health. To measure and promote a sustained systemwide investment in primary care and behavioral health, OHCA will set spending benchmarks for primary care and behavioral health services and promote investments into models that integrate primary care and behavioral health services or that leverage alternative payment models to improve access, quality, and care coordination.

      d. Health Care Workforce Stability and Training. To ensure that the implementation of cost-reducing strategies does not negatively impact workforce stability, OHCA will develop health care “workforce stability” standards to incorporate into statewide cost growth targets by 2024.
    • SB-184 is a blueprint with much left to design and define. SB-184 is a blueprint for OHCA and California’s benchmarking program that leaves much to design (e.g., performance measurement methodology) and define (e.g., health care “sector”).
    • Stakeholder engagement will be essential for program success. With the Board officially appointed, expect OHCA to set up an accelerated schedule of public meetings to support program design and implementation.
    • Transparency is at the core of OHCA’s design. Public transparency is built into SB-184, requiring the establishment of a Health Care Affordability Board (to be run in accordance with Bagley-Keene requirements) and a Health Care Affordability Advisory Committee. Both the Board and the Committee are expected to be publicly consulted on crucial program development and market accountability decisions.
    • Benchmarking programs are about culture change. Benchmarking programs seek to engage public and private stakeholders around a common goal and develop collective and clear pathways and expectations for reaching that goal.
    • Playing the long game. Culture change—and benchmarking program development—takes time. Stakeholders should not expect major market reporting prior to the Baseline Report until mid-2025 or major system “accountability” actions (e.g., performance improvement plans) until the late 2020s, at the earliest.
    • Missing data for key populations and services. Federal regulations limit the ability of state APCD agencies to collect data from self-insured plans covered by the Employee Retirement Income Security Act (ERISA) and from federally managed health care programs, creating data gaps for up to a third of state residents.
    • Inconsistent data collection and access requirements. Each state APCD agency has its own protocols for how it collects, curates, and releases data, impeding cross-state data access and analytic comparisons.
    • Need for sustainable and adequate funding for state health data capacity. State APCDs are often underinvested in resources and lack the level of sustained and reliable federal and state funding required to hire and retain top-flight talent and to invest in the foundational data, data management, and analytic infrastructure required to demonstrate their full capabilities.
    • Establishing national APCD data standards, which would allow states to fill their largest data collection gap: data for ERISA-preempted, self-insured health plan members, which comprise approximately one-third of state lives.2
    • Facilitating the collection and distribution of federally administered health care data back to participating state APCDs, including data for individuals served by Medicare, TRICARE, and the Federal Employee Health Benefit Plan (FEHBP).
    • Releasing aggregate data to the public at no charge and making more detailed data available to patients, states, providers, payers, and researchers at cost and to the extent allowed by federal law and National HDO privacy protections.
    • Reporting on national, cross-state, and regional trends in health care access, utilization, and costs.
    • Responding to state, federal, and congressional requests relating to data in the database.
    • Required compliance with HIPAA and other federal data privacy laws when collecting, transmitting, and releasing data.
    • Establishment of clear and public data use and release policies, developed with the Governing Board.
    • De-identification of data prior to release while retaining the ability to link data longitudinally for research purposes and allow for risk adjustment and geographic analysis.


manatt-black

ATTORNEY ADVERTISING

pursuant to New York DR 2-101(f)

© 2024 Manatt, Phelps & Phillips, LLP.

All rights reserved