
Published On
May 1, 2025
Authors
Hidden in Plain Sight: Quantifying The Value of Primary Care in a Health System
While primary care has long been lauded for its essential contributions to health care access and quality outcomes, health systems often view employed primary care practices as a financial drain (the American Medical Group Association [AMGA] estimates a median loss of $249,000 per physician). In the current budget environment, health systems may be adverse to sustaining their investment in primary care, let alone increasing it. However, primary care is a necessity for growth and aligning with Make American Healthy Again (MAHA) priorities to combat chronic disease.
Even in traditional pay-for-performance models without two-sided risk, employed primary care practices can generate substantial financial value for their health systems. By deploying a holistic panel-based approach that minimizes network leakage, realizes improvements in value-based quality measures, and manages demand for acute facility resources, employed primary care practices produce accretive financial returns. They also drive tangible improvements to employee health and productivity. These benefits are enabled by robust practice infrastructure and other operational supports.
Methodology for Quantifying the Value of Primary Care
The following outlines how to calculate and enable the financial benefits of employed primary care for a typical health system network. Calculations are based on an illustrative multi-office practice of 40 physicians, a substantial complement of Advanced Practice Providers (e.g., nurse practitioners, physician assistants),and 100,000 paneled lives with a representative payer mix including 15,000 Medicare Advantage (MA) lives.
Figure 1. Drivers of Primary Care Financial Value
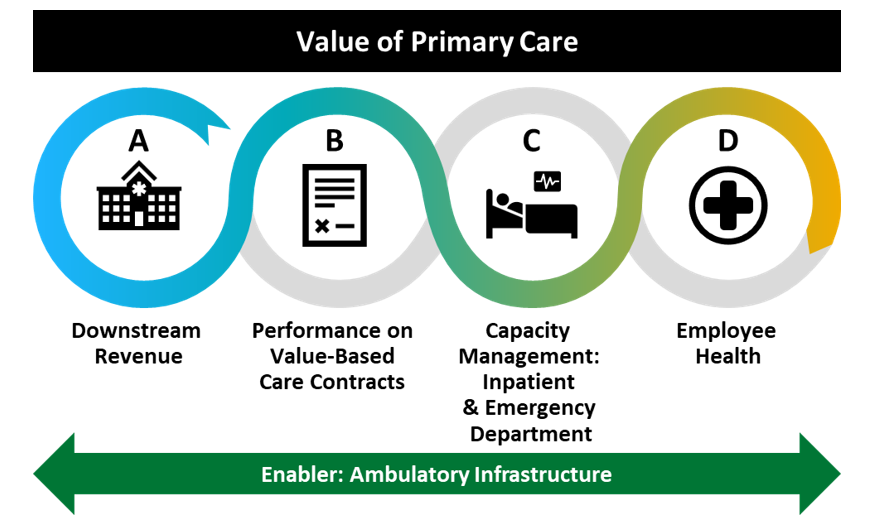
A. Downstream Revenue
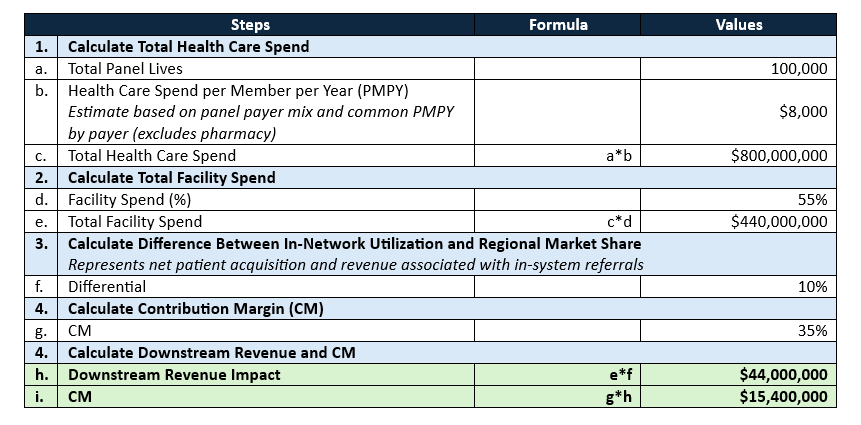
In-system referrals drive the majority of primary care’s value to health systems through downstream revenue. Capturing these referrals requires an accessible network of primary specialists and ancillary services. Without such access, leakage to non-aligned providers and systems results in the loss of revenue for the initial specialty referral and any subsequent non-aligned subspecialty referrals.
The increased system market share from the employed practice’s patients relative to the system’s market share in comparable geographies serves as a benchmark to measure the downstream benefit. For example, if a system has a market share of 40% in the primary care practice’s service area, and the system’s market share of practice referrals is 60%, a 20% market share differential would be imputed. The example outlined in Table 1 assumes our hypothetical practice achieves a conservative 10% differential.
There are regulatory constraints on requiring or inducing physicians who are not employed by the hospital to make in-system referrals. However, there is a regulatory exception allowing hospitals, subject to certain exceptions, to require employed physicians to make in-system referrals when acting within the scope of their employment, so long as their compensation does not take the volume or value of those referrals into account. These referrals can generate downstream revenue. Table 1 presents an illustrative calculation of financial benefit.
Table 1. Calculating Downstream Revenue
Values are illustrative unless stated otherwise
The estimates above were built from extensive experience with multiple system-payer partnerships that included shared data on total panel utilization (not just utilization of the sponsoring system). Data vendors are increasingly modeling these metrics from large, purchased data sets. Understanding total patient utilization of a panel is critical to optimizing network utilization, capturing leakage, and maximizing downstream revenue.
B. Performance on Value-Based Care (VBC) Contracts
Depending on the market and health system strategy, primary care practices have a broad range of VBC contract opportunities. For the purposes of this analysis, we’ve focused exclusively on broadly available pay-for-performance MA contract incentives and not higher-risk, advanced primary care models (e.g., global capitation or two-sided risk models such as the Accountable Care Organization Realizing Equity, Access, and Community Health model [ACO REACH]). Higher returns are available in these more complex models but require greater risk appetite and substantial practice investments.
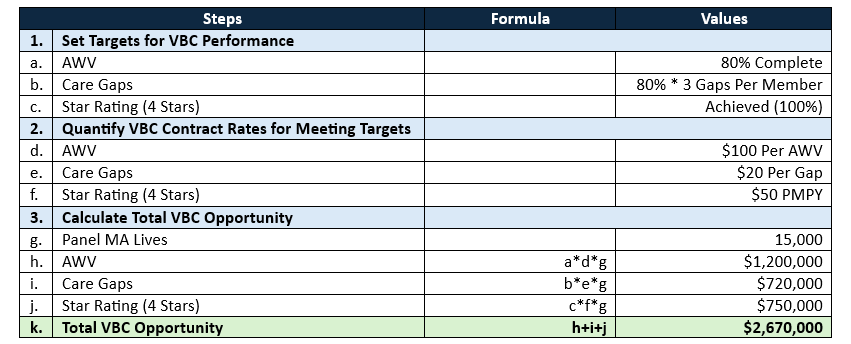
The rapid expansion of MA—with the Medicare market expected to exceed 60% by 2030—has transformed primary care contracting opportunities. As MA risk adjustment and star ratings play a critical role in determining plan revenue, payors are providing substantial supplementation to primary care reimbursement to lift scores. A common schema provides over $100 for annual wellness visits (AWV), $10–30 payments for the closure of individual care gaps, and $50 PMPY for 4-star performance.
The example outlined in Table 2 estimates the outcomes for our hypothetical practice with a 15,000 MA life panel.
Table 2. Calculating Revenue Associated with Improved Performance on VBC Contracts
Values are illustrative unless stated otherwise
Often, a portion of these benefits are shared with the primary care team through variable pay arrangements to align incentives for quality.
C. Capacity Management: Inpatient (IP) and Emergency Department (ED)
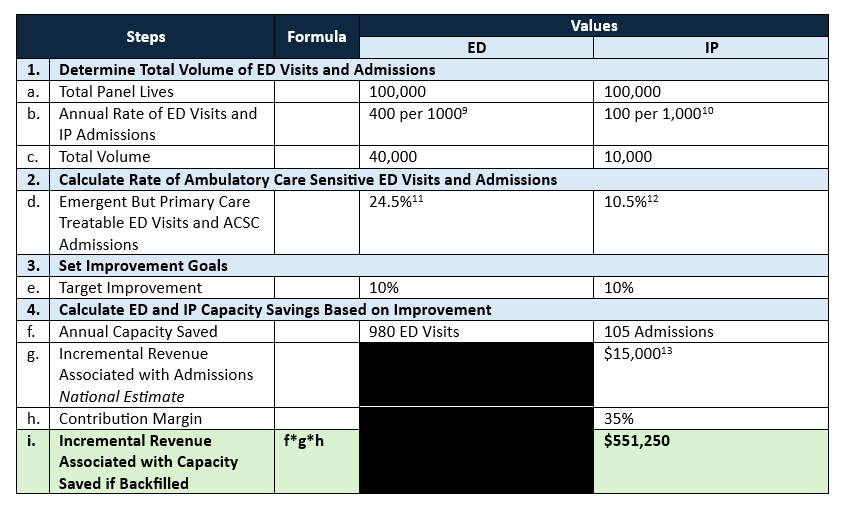
A strong primary care practice can reduce unnecessary ED utilization and admissions through rigorous management of chronic diseases, health-related social needs, and care coordination. Quantifying the value of increased ED and IP capacity relies on understanding a health system’s ability to reduce unnecessary admissions related to ambulatory care sensitive conditions (ACSCs) and emergent but primary care-treatable ED visits (Table 3 uses the well-established New York University ED algorithm). The example outlined in Table 3 assumes a 10% improvement—only inpatient benefit is quantified because of its direct connection to additional revenue potential. This analysis assumes that any backfilled capacity is used for services of average intensity, though some health systems without backfill opportunity may only experience modest cost reduction savings.
Table 3. Methodology for Calculating Revenue Associated with Increased ED and IP Capacity
Values are illustrative unless stated otherwise
D. Employee Health
Health care is a notoriously high-stress field with difficult physical and mental working conditions that lead to employee burnout, presenteeism, and, ultimately, reduced productivity. Health care workers are among the highest cost employment groups and suffer high rates of chronic physical and mental health conditions. In addition, over half of the most common conditions (e.g., pain, cardiometabolic disease) leading to productivity loss can be mediated through primary care; therefore, health systems that invest in strong employed primary care practices and provide primary care access to their employees (for those comfortable receiving care in their place of employment) are better positioned to reduce presenteeism and improve health system workforce satisfaction and productivity.
Enabler: Ambulatory Infrastructure
A strong ambulatory infrastructure must support the primary care service and drive accountability for achieving improvements for in-network utilization, VBC quality metrics, and reductions in ambulatory care sensitive ED visits and admissions. Key capabilities include:
- Rigorous practice management and operational supports to promote clinical productivity, efficient workflows, and template management;
- Skilled managed care contracting and disciplined collections;
- Staffing complement that aligns with the health system’s managed care contracting strategy (e.g., one-sided risk versus two-sided risk) and effectively engages patients in chronic disease management (e.g., care managers, dieticians, behavioral health specialists);
- Physician compensation model that supports clinical productivity and VBC goals; and
- Well-structured analytics to support VBC contract success and continuous improvement.
There are costs associated with this infrastructure, but those costs are outweighed relative to the positive yields described above. Practices with mature infrastructure experience are better able to address the clinician burnout in these primary care settings.
The Bottom Line: Translating Value to Action
The analysis above suggests that our illustrative, medium-sized, multi-office practice of 40 physicians with 100,000 panel lives in a relatively traditional contracting environment could yield ~$15–20 million (Downstream Revenue + VBC Contract Returns + Increased Capacity) in financial benefit against an operating loss of $10 million (40 physicians at a $249,000 loss per physician). This practice also supports better quality, access, and employee health.
In these challenging times, as health systems scrutinize their service lines for quality and financial returns, primary care can emerge as a strong contributor across both dimensions. Tracking broader financial impact, beyond operating losses, can drive the strategic intent to nurture and grow primary care to promote health system financial stability while driving broader missions.
Acknowledgements: The authors would like to acknowledge Subbu Ramalingam, CEO, ViVega and Managing Director, ATTAC Consulting as well as Brent Savoie, MD, independent consultant for their experience-based insights around MA primary care contracting and performance.
Shryock, T. (2024, January 10). Medical Group Struggle as Operating Costs Surpass Revenue. Medical Economics. .
Exec. Order No. 14,212, 90 F.R. 9833 (2025). .
Over last 20 years, there has been a lot of emphasis on better payment models for primary care practices to drive better outcomes. McCauley, L., Phillips, Jr., R. L., Meisnere, M., & Robinson, S. K. (2021). Implementing High-Quality Primary Care. The National Academies of Sciences, Engineering, and Medicine. .
This framework reflects the financial value of primary care. Other values—particularly patient outcomes, safety, and satisfaction—are often attributed to primary care, but not typically enough to drive strategic growth and investment given primary care’s reputation as an operational loss leader in resource-constrained environments.
Neuman, T., Freed, M., & Biniek, J. F. (2024, January 30). 10 Reasons Why Medicare Advantage Enrollment is Growing and Why It Matters. KFF. .
Manatt and adviser experience (see Acknowledgement).
Centers for Medicare & Medicaid Services. (2019, December 6). Reducing Unnecessary Emergency Department Visits. .
Loenen, T., Berg, M. J., Westert, G. P., & Faber, M. (2014, October). Organizational aspects of primary care related to avoidable hospitalization: a systematic review. Fam Pract, 31(5), 502-16. .
KFF. (2022). Hospital Emergency Room Visits per 1,000 Population by Ownership Type. .
KFF. (2022). Hospital Admissions per 1,000 Population by Ownership Type. .
Giannouchos, T. V., Ukert, B., & Wright, B. (2024, January 10). Concordance in Medical Urgency Classification of Discharge Diagnoses and Reasons for Visit. JAMA, 7(1), e2350522. .
Loyd, C., Blue, K., Turner, L., Weber, A., Guy, A., Zhang, Y., Martin, R. C., Kennedy, R. E., & Brown, C. (2023, March 20). National Norms for Hospitalizations Due to Ambulatory Care Sensitive Conditions Among Adults in the US. J Gen Intern Med, 38(13), 2953-2959. .
MD Clarity. (n.d.) Average Revenue per Inpatient Admission. .
Presenteeism—in which employees are working but are less productive and more prone to errors than they could be due to a variety of factors including physical health, mental health, and low morale—affects all industries. For example, a recent integrative study reported up to of nurses experiencing symptoms of presenteeism. Productivity losses have been quantified anywhere from . And the than other industries due to the potential for transmission of infectious disease when symptomatic workers come to the office and the potential for major patient safety events when clinical decision-making is impaired.
Homrich, P. H. P., Dantas-Filho, F. F., Martins, L. L., & Marcon, E. R. (2020, August 4). Presenteeism Among Health Care Workers: Literature Review. Rev Bras Med Trab, 18(1), 97-102. .
Bureau of Labor Statistics. (2025, March 14). Employer Costs for Employee Compensation – December 2024. .
Silver, S. R., Li, J., Boal, W. L., Shockey, T. L., & Groenewold, M.R. (2020, September 11). Prevalence of Underlying Medical Conditions Among Selected Essential Critical Infrastructure Workers — Behavioral Risk Factor Surveillance System, 31 States, 2017–2018. MMWR, 69(36), 1244-1249. .
Rojanasarot, S., Bhattacharyya, S. K., & Edwards, N. (2023, February 14). Productivity Loss and Productivity Loss Costs to United States Employers Due to Priority Conditions: A Systematic Review. J Med Econ, 26(1), 262-270. .
American Academy of Family Physicians. (2023, October). Family Physician Burnout, Well-Being, and Professional Satisfaction (Position Paper).