
Published On
September 29, 2026
Authors
Preliminary 2027 ACA Rates Are Up Regardless of Marketplace Type or State Subsidies
Insurers across the country have filed preliminary rates for Plan Year 2027, offering an early look at the affordability of Marketplace coverage ahead of the 2027 Open Enrollment cycle. This year’s filings arrive against an unprecedented and uncertain backdrop: enhanced premium tax credits, in place since 2021, expired at the end of 2025, and enrollment in Marketplace coverage due to reduced affordability, shrinking and worsening the risk pool for those who remain. This Manatt Health Vital Signs 50-State Tracking bulletin summarizes topline trends in proposed rate increases across Federally-Facilitated Marketplace (FFM) and State-Based Marketplace (SBM) states—including states with dedicated state subsidy programs—and highlights the high-level primary rationales carriers are citing for this year’s increases.
Notably, on September 22, 2026, the Centers for Medicare & Medicaid Services (CMS) it had cancelled coverage for 760,000 Marketplace enrollees and separately noted that more than 400,000 additional enrollments are under review. The agency offered limited details about the individuals affected but cited potentially fraudulent activity. These developments add further uncertainty to an already volatile enrollment picture as states continue to negotiate and finalize rates with insurers. The impact of enrollment changes and additional state or regional trends will become apparent ahead of Open Enrollment on November 1.
Key Takeaways
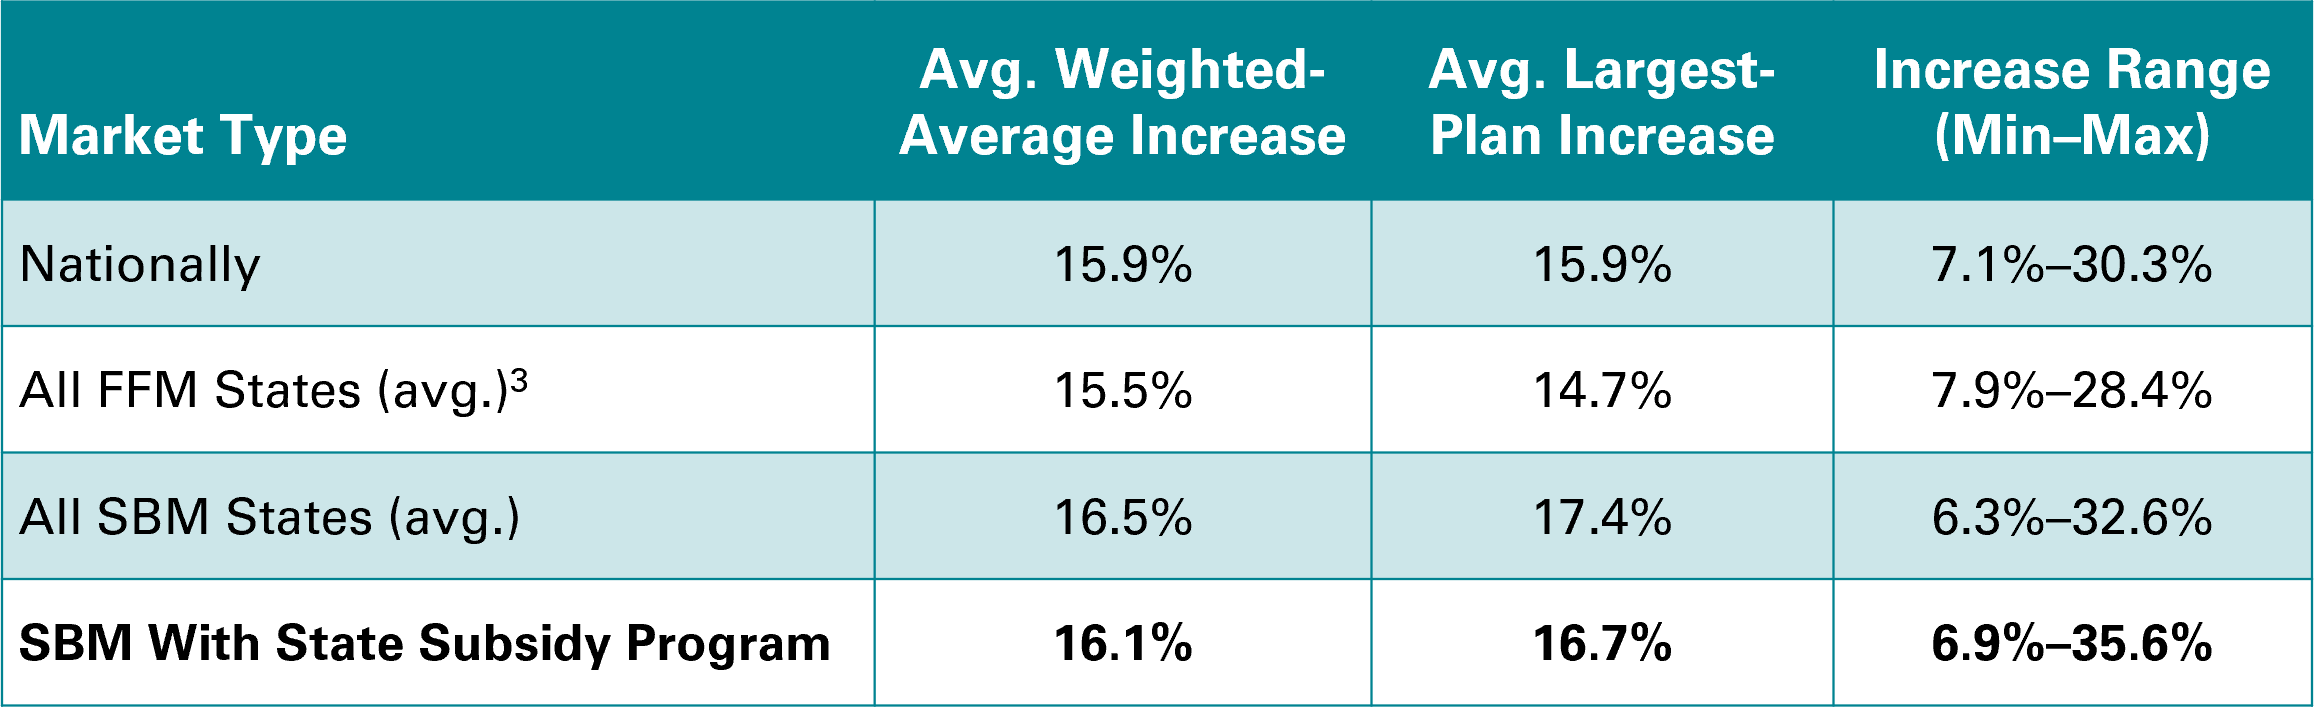
- Average premium increases in the preliminary rate filings are 15.9% ( 15%). Rate increases in 2026 and 2027 represent the highest increases in recent years. For context, proposed median rate increases ranged from 6–10% from , when enhanced premium tax credits were in place.
- Rate increases are strikingly similar nationwide, regardless of whether a state took action to offset the loss of enhanced advanced premium tax credits, suggesting there are significant factors beyond risk-pool decline that are driving this year’s increases across the board.
- FFM states are trending slightly lower than SBM states. On average, weighted-average rate increases in FFM states (15.5%) are running about 1.0 percentage point lower than in SBM states (16.5%).
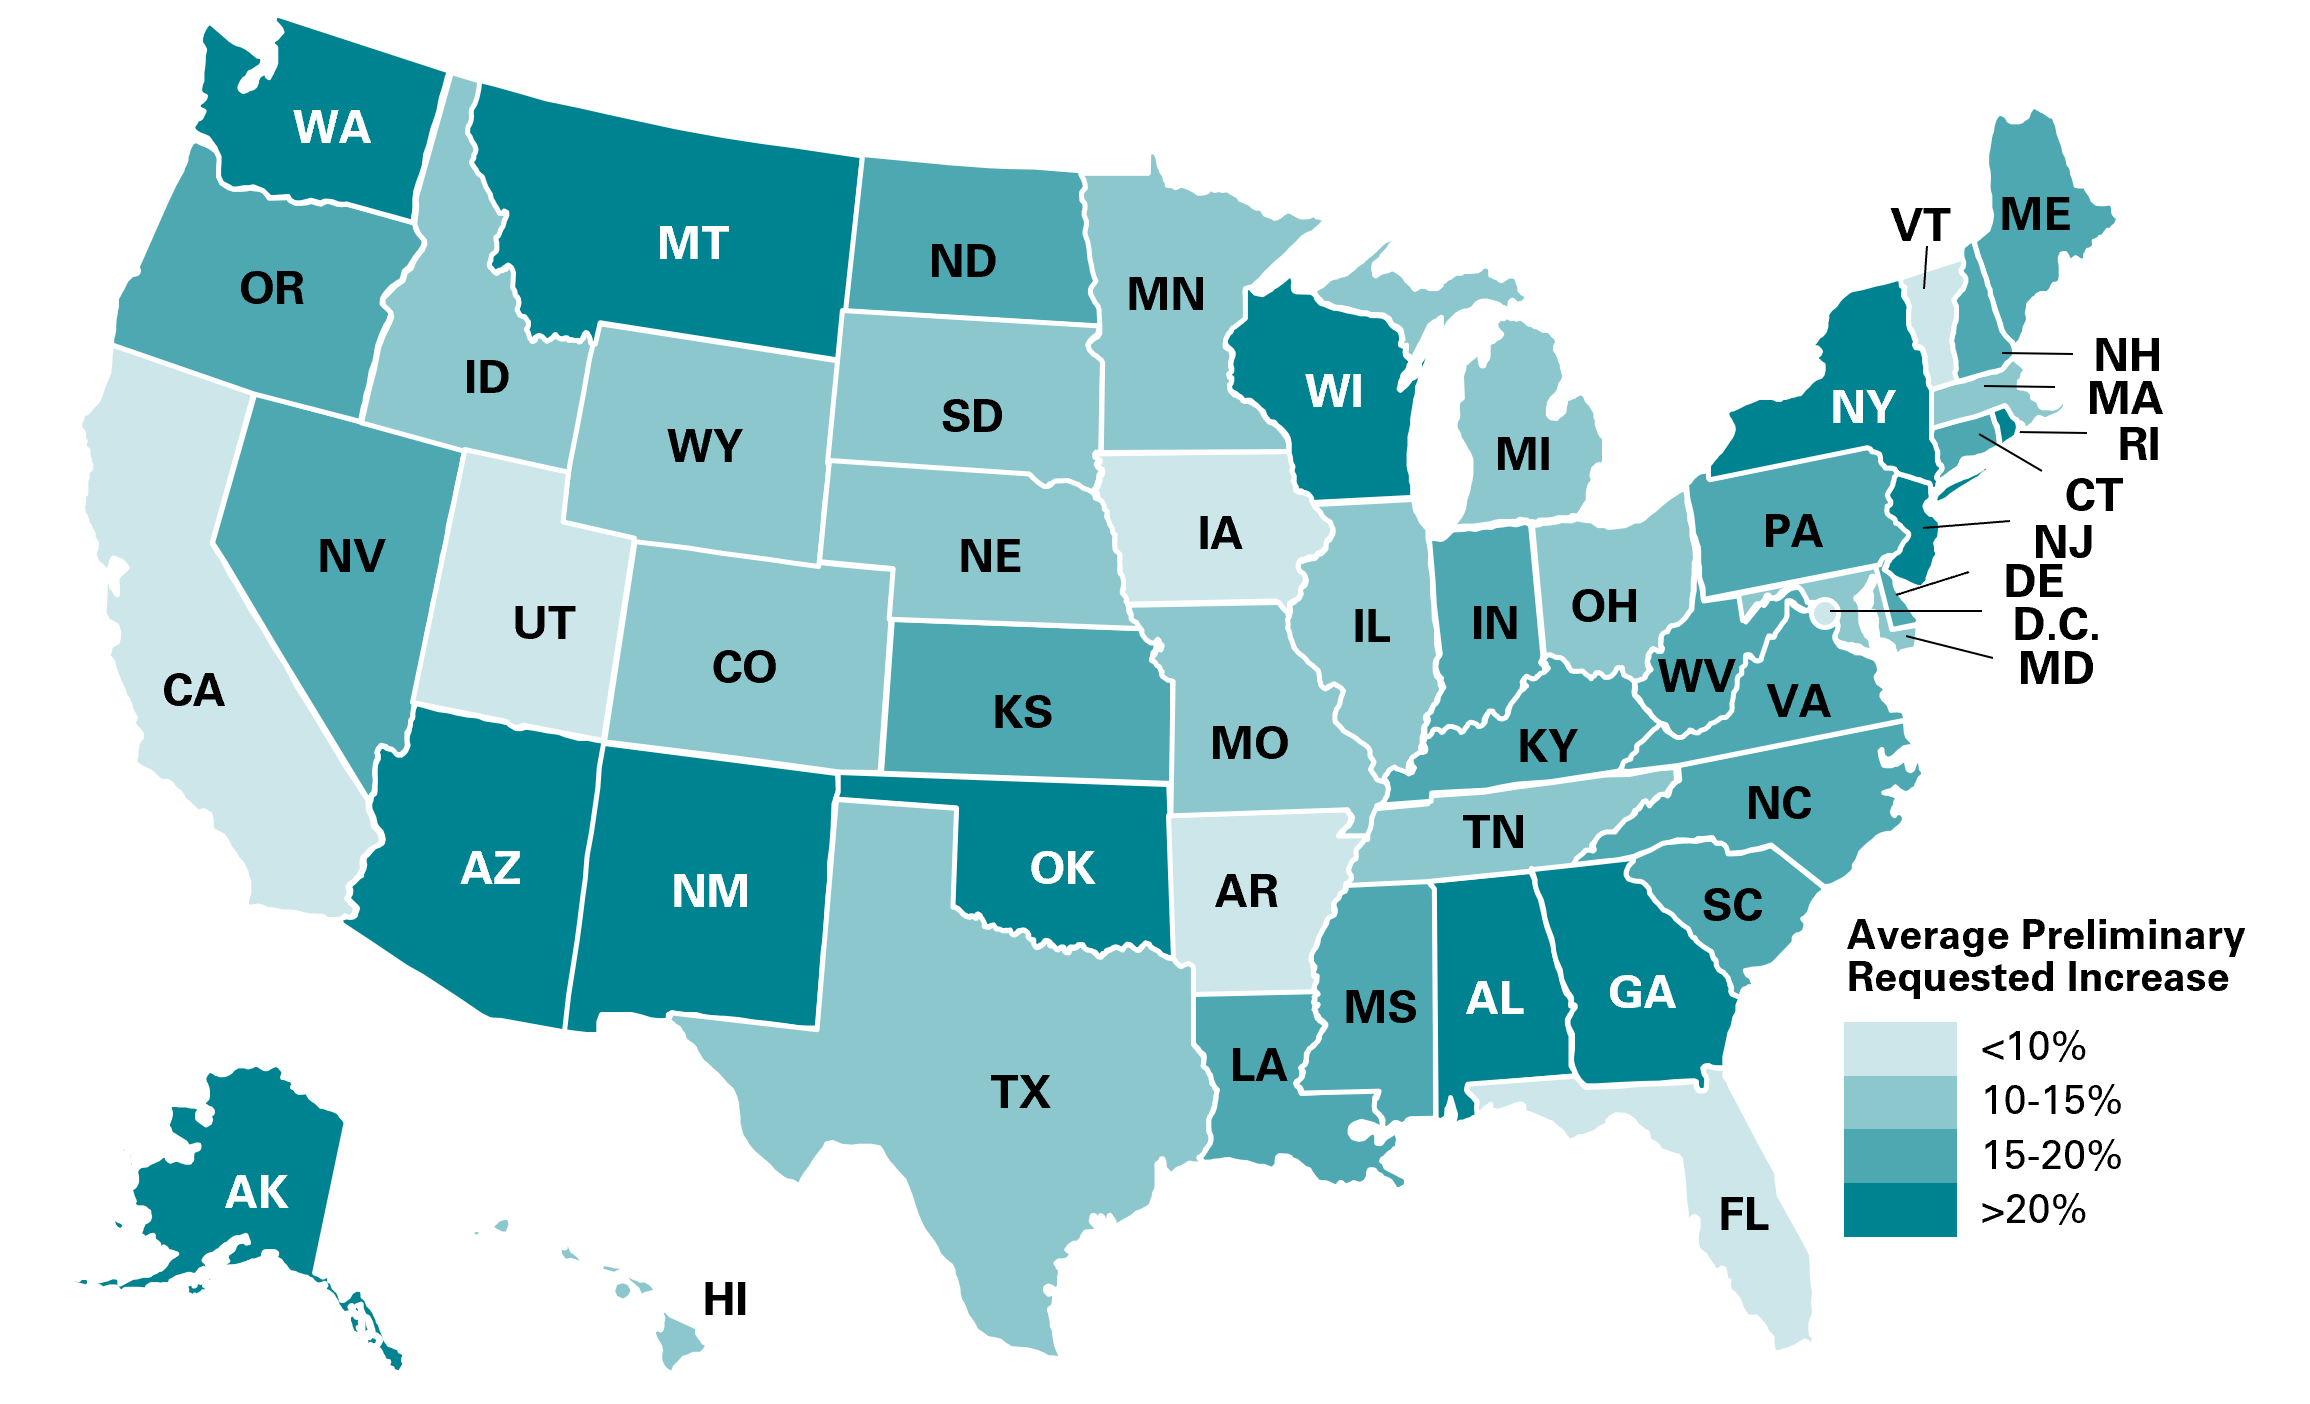
- SBM states that had subsidy programs in 2026 are trending similar to SBMs without additional financial assistance. For example, New Mexico has a subsidy program to fully replace expired enhanced federal tax credits but has one of the highest preliminary requested increases, at 25.6% (finalized at 24.4%).
- According to issuers’ submitted rate justifications, medical trend is the primary rationale to justify increased rates followed by continued uncertainty from the loss of enhanced premium tax credits, risk adjustment payments and prior year losses, and increased pharmaceutical spending.
- States and the federal Marketplace continue to evaluate the preliminary rates and make adjustments, including reducing the premium increases, so these increased rates may not be final.
The Landscape by Market Type
Average largest-plan and weighted-average proposed rate increases, plus the range of increases observed, by market type:
Why Rates Are Rising: Primary Rationales
Beyond market type, carriers’ actuarial memos point to several recurring cost drivers behind this year’s proposed increases:
Medical Trend
Almost every filing identifies medical trend as the foundational cost driver, with carriers citing general inflation and health care labor shortages that have pushed hospitals and physician groups to demand higher contracted reimbursement rates. A found current plans would rise by 11% absent benefit changes, and medical spending is projected to increase for the fifth consecutive year. Further, hospital and related services inflation .
Enhanced Subsidy Expiration
Many carriers explicitly quantify the impact of enhanced subsidy expiration in their actuarial rate filings, citing higher morbidity assumptions and anticipated further enrollment losses as healthier, more price-sensitive members continue to forego insurance due to increased cost.
Risk Adjustment and Prior-Year Losses
Many carriers cite adverse 2025 financial performance, pointing to cumulative losses in recent years and unfavorable shifts in their estimated net risk-adjustment transfer positions as key drivers of this year’s requested increases. In 2025, according to CMS, payors a combined $11.2 billion in risk-adjustment charges—or $22.3 billion in total gross transfers.
Pharmacy Impact
Specialty medications continue to represent a disproportionate share of cost growth, with a small group of enrollees driving total drug spending in many filings. Carriers also note that GLP-1 costs remain elevated due to diabetes indications, even as coverage for weight-loss indications has been scaled back. This mirrors the national pattern: overall prescription drug spending in 2026 is to rise by 10.0% to 12.0% compared to 2025, a continued trend as specialty drug prices and use continue to rise and new, expensive drugs enter the market.
Looking Ahead
These figures reflect preliminary filings and remain subject to state regulatory review and revision before final rates are approved and before window shopping for 2027 Open Enrollment can begin. To date, a handful of states have decreased the requested rate at finalization, suggesting some of the preliminary rates may have been overstated. But a state’s ability to decrease requested rates will vary by state-specific market dynamics. For example, cut insurers’ requested individual market increase from 20.6% down to 6.0%, while increased individual rates between preliminary and final from 17.5% to 21.6%. As more states finalize their 2027 rates, a fuller and more reliable picture of subsequent premium costs will emerge, revealing trends in where and how states may be able to protect consumer affordability amid this year’s rate pressures.
While most enrollees will still receive subsidies under the original Affordable Care Act structure, unsubsidized enrollees (including those over 400% FPL who received financial assistance under the enhanced subsidies) will absorb the full cost of premium increases.
Weighted averages were calculated based on publicly available preliminary 2027 individual market rate filings. Semi-weighted averages were calculated in 15 states (AZ, AR, DE, MS, NE, NV, NC, ND, OH, OK, SC, SD, TN, VA and WV) when rate filings omitted enrollment data. Enrollment was estimated by equally distributing the difference between 2026 Open Enrollment period plan selections and the sum of enrollees reported in other rate filings among issuers with omitted enrollment data. In Florida and Wyoming, weighted averages were calculated using 2025 enrollment data as 2026 data was unavailable.
